Fig. 1.
Download original image
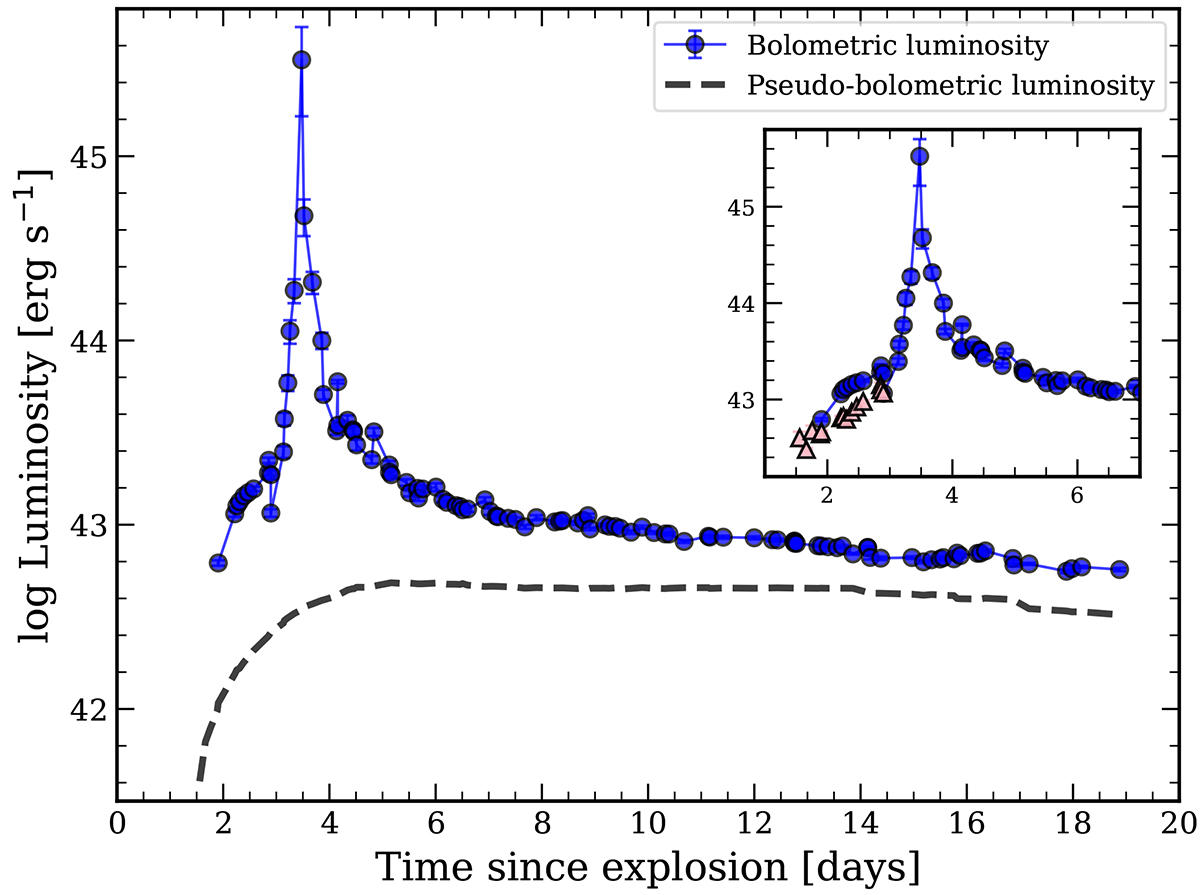
Early bolometric light curve for SN 2023ixf (blue dots). The dashed line represents the pseudo-bolometric light curve. The inset plot shows the first week of evolution of the bolometric luminosity. In this plot, the pink triangles are the bolometric luminosities when observed UV data are not taken into account in the calculation method. In most cases the error bars are smaller than the dot size.
Current usage metrics show cumulative count of Article Views (full-text article views including HTML views, PDF and ePub downloads, according to the available data) and Abstracts Views on Vision4Press platform.
Data correspond to usage on the plateform after 2015. The current usage metrics is available 48-96 hours after online publication and is updated daily on week days.
Initial download of the metrics may take a while.