Fig. A.1.
Download original image
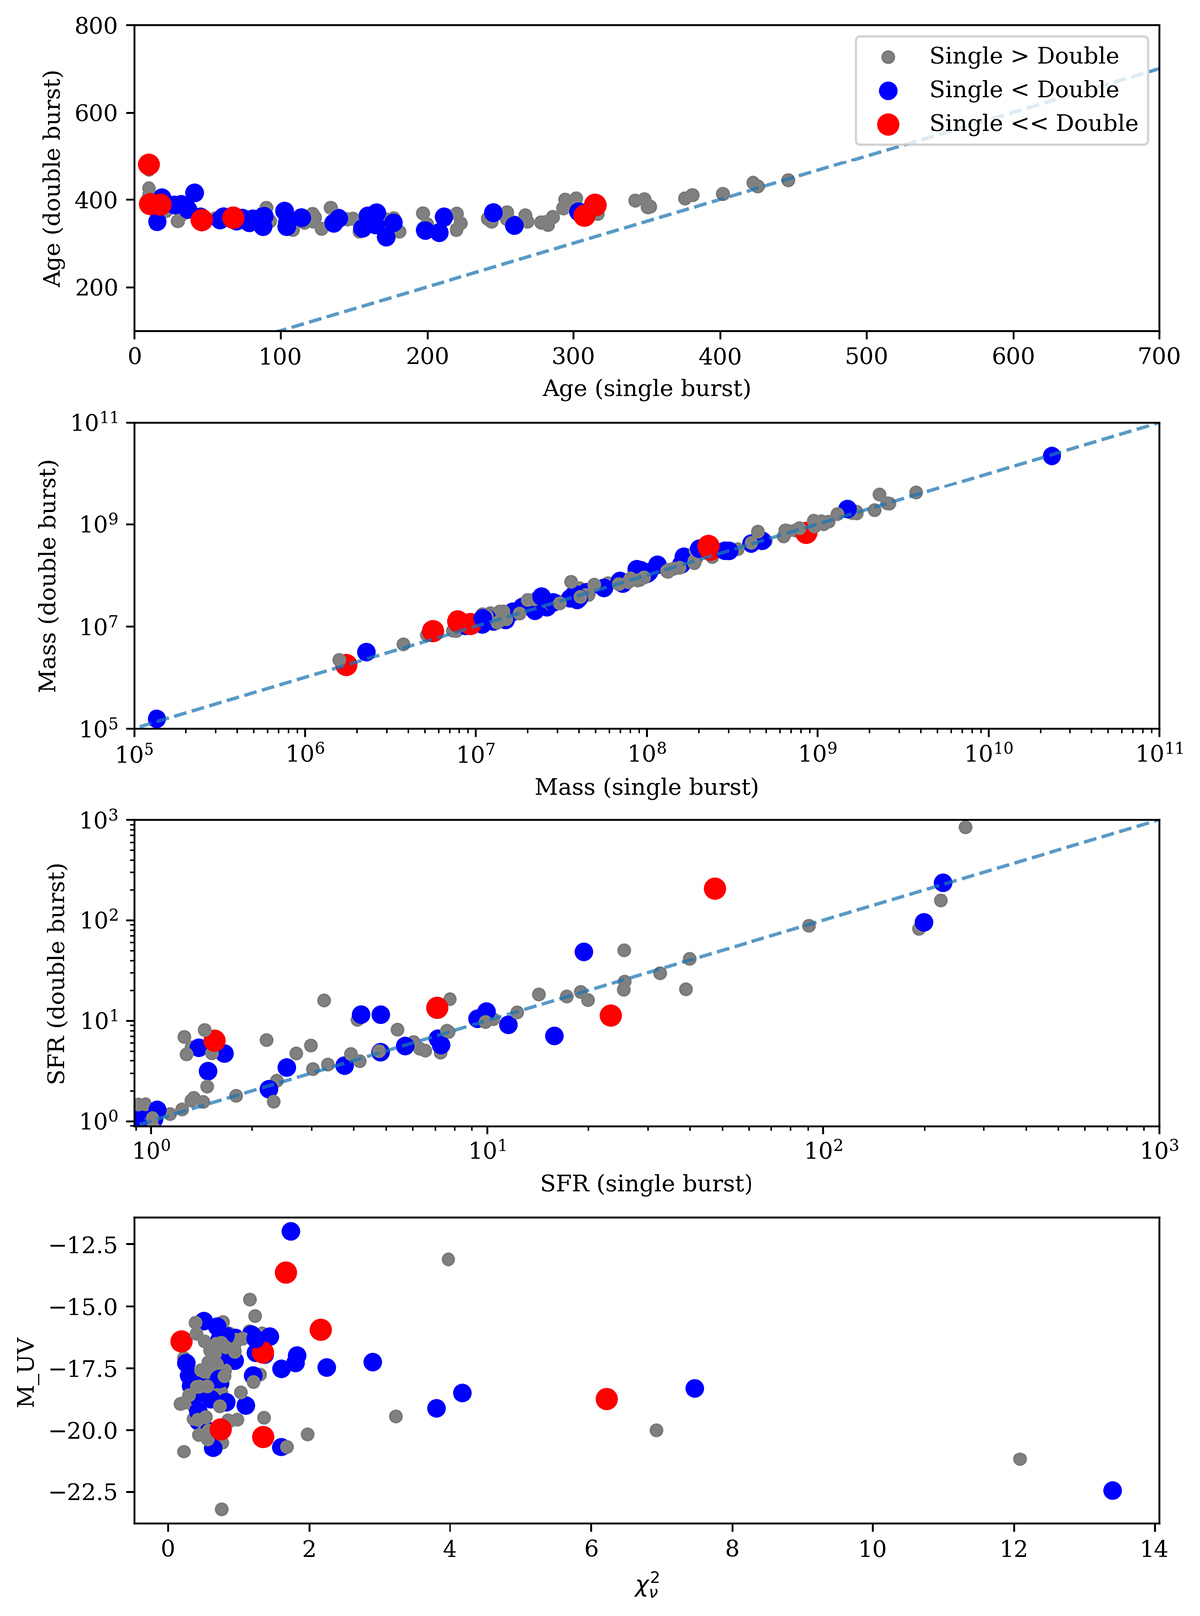
Comparison of the two SFHs used in the CIGALEfitting process: the single burst model (x-axis) and the double burst model (y-axis). These graphs include the highly-magnified object described in the main text and removed from the MS fitting. In descending order, the graphs depict the comparison of the age of the main stellar population, the stellar mass, the SFR, and the ![]() statistic. Grey dots indicate galaxies for which the single burst model is a better fit and coloured dots indicate galaxies for which the double burst model is better. Red dots indicate galaxies for which the double burst model is significantly better than the single burst model. Error bars on these values are described in the caption of Fig. 3.
statistic. Grey dots indicate galaxies for which the single burst model is a better fit and coloured dots indicate galaxies for which the double burst model is better. Red dots indicate galaxies for which the double burst model is significantly better than the single burst model. Error bars on these values are described in the caption of Fig. 3.
Current usage metrics show cumulative count of Article Views (full-text article views including HTML views, PDF and ePub downloads, according to the available data) and Abstracts Views on Vision4Press platform.
Data correspond to usage on the plateform after 2015. The current usage metrics is available 48-96 hours after online publication and is updated daily on week days.
Initial download of the metrics may take a while.