| Issue |
A&A
Volume 690, October 2024
|
|
|---|---|---|
| Article Number | A391 | |
| Number of page(s) | 4 | |
| Section | Extragalactic astronomy | |
| DOI | https://doi.org/10.1051/0004-6361/202451463 | |
| Published online | 24 October 2024 | |
A measurement of the escaping ionising efficiency of galaxies at redshift 5
1
Institute for Theoretical Physics, Heidelberg University, Philosophenweg 12, D-69120 Heidelberg, Germany
2
Max-Planck-Institut für Astronomie, Königstuhl 17, 69117 Heidelberg, Germany
⋆ Corresponding author; bosman@thphys.uni-heidelberg.de
Received:
11
July
2024
Accepted:
3
September
2024
The escaping ionising efficiency from galaxies, fescξion, is a crucial ingredient for understanding their contribution to hydrogen reionisation, but both of its components, fesc and ξion, are extremely difficult to measure. We measured the average escaping ionising efficiency ⟨fescξion⟩ of galaxies at z = 5 implied by the mean level of ionisation in the intergalactic medium via the Lyman-α forest. We used the fact that Nion = ρUV fesc ξion, the product of the ionising output and the UV density ρUV, can be calculated from the known average strength of the UV background and the mean free path of ionising photons. These quantities, as well as ρUV, are robustly measured at z ≤ 6. We calculated the missing factor of ⟨fescξion⟩ at z = 5 during a convenient epoch after hydrogen reionisation had been completed and the intergalactic medium had reached ionisation equilibrium but before bright quasars began to dominate the ionising photon production. Intuitively, our constraint corresponds to the required escaping ionising production from galaxies in order to avoid over- or under-ionising the Lyman-α forest. We obtained a measurement of log⟨fescξion⟩/erg Hz-1 = 24.28+0.21-0.20 at z = 5 when integrating the ρUV down to a limiting magnitude Mlim = −11. Our measurement of the escaping ionising efficiency of galaxies is in rough agreement with both observations of early galaxies and with most models.
Key words: galaxies: high-redshift / intergalactic medium / dark ages / reionization / first stars
© The Authors 2024
 Open Access article, published by EDP Sciences, under the terms of the Creative Commons Attribution License (https://creativecommons.org/licenses/by/4.0), which permits unrestricted use, distribution, and reproduction in any medium, provided the original work is properly cited.
This article is published in open access under the Subscribe to Open model. Subscribe to A&A to support open access publication.
1. Introduction
The process of reionisation is thought to be driven by galaxies at 5.5 ≲ z ≲ 10. Recently, the discoveries of unexpectedly high numbers of galaxies at z > 10 (Finkelstein et al. 2024) and of their ability to carve out large ionised regions at z ≳ 7 (Mason & Gronke 2020; Torralba-Torregrosa et al. 2024) have raised concerns that early galaxies would complete reionisation too early compared to constraints from the Lyman-α forest (Muñoz et al. 2024; Simmonds et al. 2024; but see Davies et al. 2024a).
To reconcile observations of powerfully-ionising early galaxies with the known late ending of reionisation (Bosman et al. 2022), renewed interest has risen in precise indirect diagnostics of the production rate of ionising photons by early galaxies (e.g. Tang et al. 2019) and in the escape fraction of these photons from their hosts (e.g. Jaskot et al. 2024a,b). In this paper, we point out that the product of these quantities – the escaping ionising output of galaxies per unit UV production – is already known fairly precisely at z = 5. Our constraints thus provide an independent consistency check of galaxy evolutionary models and indirect tracers of ionisation production right after the end of reionisation.
2. Methods
A popular way to conceptualise the progress of the hydrogen reionisation is via the Madau equation (Madau et al. 1999):
Here, the effects of the production of ionising photons from galaxies at a rate Ṅion and the recombination of ionised hydrogen atoms inside sinks on a characteristic timescale trec combine to increase the ionised fraction of hydrogen QHII.
Both terms in this equation are elusive and the focus of much theoretical and observational work. In this paper, we focus on the first ‘source’ term, which is customarily written in terms of the bulk properties of the ionising galaxies:
where ρUV is the UV luminosity density, ξion is the production rate of ionising photons (λ < 912 Å) per unit UV production, and fesc is the escape fraction of ionising photons from galaxies. In particular, we constrain the product of the latter two terms, fescξion – the escaping ionising efficiency.
The most interesting regime for ⟨fescξion⟩ is the epoch of reionisation itself, at z ≥ 5.3 (Bosman et al. 2022). However, any measurements at later times are still valuable to constraining models of galaxy formation during the epoch of reionisation. At z = 5, which is before bright quasars begin to contribute significantly to Ṅion (e.g. Finkelstein & Bagley 2022) but after the establishment of a homogeneous UV background in the intergalactic medium (IGM), both ρUV and Ṅion have been measured fairly robustly.
2.1. Ṅion
The global production rate of ionising photons Ṅion is closely related to Γ, the average ionisation rate in the IGM (e.g. Gaikwad et al. 2023; Davies et al. 2024b). Below, we briefly reproduce the mathematical argument linking the two parameters.
Under the ‘local source’ approximation (Meiksin & White 2003), the intensity of ionising radiation in the IGM is roughly equal to the product of the ionising emissivity ϵ(ν) and the mean free path of ionising photons λ(ν):

We can then re-write Ṅion as an integral over the ionising emissivity,
where α encodes the frequency dependence of emission from sources past the Lyman-limit νLyC:
This leads to a direct link between Γ and Ṅion:
where σHI is the photoionisation cross-section of neutral hydrogen. It is frequently assumed that λ(ν) = λLyC(ν/νLyC)−0.9 (Gaikwad et al. 2023; Davies et al. 2024b), where λLyC is the mean free path of photons at the Lyman limit. Instead of extending to infinity, the integrals in Eqs. (4) and (6) are truncated at 4νLyC, where the spectra of galaxies have a sharp break at the helium-ionising edge.
In practice, Γ is measured from the mean transmitted flux in the Lyman-α forest by means of comparison with numerical simulations. While newer measurements have employed radiative-transfer simulations that track the history of reionisation, simpler simulations with a homogeneous UV background (UVB) are sufficient at z < 5.3, where they give consistent results (Becker & Bolton 2013; D’Aloisio et al. 2018; Bosman et al. 2022; Davies et al. 2024b).
Equation (6) also requires a measurement of λLyC. At z = 5, the value of λLyC measured via comparison with simulations by Gaikwad et al. (2023) is in agreement with measurements from direct stacking of quasar spectra from Worseck et al. (2014), Becker et al. (2021), and Zhu et al. (2023).
We adopted  photons/s/Mpc3 at z = 5, which was computed in this manner by Gaikwad et al. (2023). The dominating source of uncertainty in the measurement of Ṅion at z = 5 is not the measurement precision of Γ or λLyC but the conversion in Eq. (6) via the spectral parameter α. A value of α = 2 is often assumed by default (e.g. Becker & Bolton 2013), but if the sources are bluer on average past the Lyman-limit, then α and Ṅion could be larger. In the above measurement from Gaikwad et al. (2023), the authors marginalised over a wide range, 1.4 ≤ α ≤ 2.6, and multiple other observational and model-dependent uncertainties are included. Interested readers will find a thorough and quantitative discussion of the uncertainties involved in converting Γ to Ṅion in Becker & Bolton (2013). Overall, we consider the uncertainties on the measurement of Gaikwad et al. (2023) to be conservative.
2.2. ρUV
The UV luminosity function (UVLF) – Φ(MUV) – of galaxies at z = 5 is well-constrained by observations from the Hubble Space Telescope down to UV magnitudes MUV ∼ −17 (Finkelstein et al. 2015; Bouwens et al. 2021) and down to MUV ∼ −14 using lensing fields (Bouwens et al. 2022). The UV luminosity density, ρUV, can be calculated directly by integrating the UVLF down to a chosen limiting UV magnitude Mlim:
Using the UVLF measurements of Bouwens et al. (2021) and taking into account the uncertainties on the overall normalisation of the UVLF, we obtained  erg/s/Mpc3/Hz for Mlim = −17 and
  erg/s/Mpc3/Hz for Mlim = −11, extrapolating below the detection limit of current telescopes. We note that the faint-end slope of the UVLF at z = 5 is sufficiently shallow to allow ρUV to converge when integrated to hypothetical infinitely faint galaxies; doing so only increases ρUV by a further 5% compared to assuming Mlim = −11.
The integrated ρUV is consistent across alternative determinations of the UVLF. Using the fit obtained by Bouwens et al. (2022) results in values of ρUV that are 2% and 8% higher than the nominal values above for Mlim = −11, −17, respectively. Using the results of Finkelstein & Bagley (2022), who parametrised the UVLF as a double power law with a turn-over instead of a Schechter function, results in the ρUV being 2% and 10% lower than the nominal values for Mlim = −11, −17, respectively. This variance is comfortably encompassed in the 1σ uncertainties of the inference based on Bouwens et al. (2021).
3. Results
When inserting the measurements of the ρUV and Ṅion into Eq. (2), the only unknown quantity is the global ⟨fescξion⟩ of the galaxies contributing to the ρUV. In the context of Eq. (1), the global ⟨fescξion⟩ can be thought of as the output of all galaxies sourcing the UVB; therefore it is sensible to extrapolate the UVLF to Mlim = −11. We obtained log⟨fescξion⟩/erg Hz−1
 (Fig. 1). This value is slightly lower (∼2σ) than constraints from the cross-correlation of the Lyman-α forest with the location of galaxies (Kakiichi et al. 2018; Meyer et al. 2019, 2020), which attribute the detection of an IGM ionisation boost to faint galaxies clustered with the bright ones they detect.
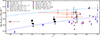 |
Fig. 1. Measurements of ⟨fescξion⟩ across redshift. Our constraints based on ρUV and Ṅion are shown for two different Mlim (black). For comparison, we show measurements from the galaxy-optical depth cross-correlation (Meyer et al. 2019, 2020), direct detections of the Lyman continuum (Pahl et al. 2021), and indirect fesc and ξion tracers (Saxena et al. 2024; Rinaldi et al. 2024; Torralba-Torregrosa et al. 2024). The implications of the LAE-driven reionisation model of Matthee et al. (2022) as well as the models of Muñoz et al. (2024) and Davies et al. (2021) are shown in shades of blue. At z = 4, our argument only produces an upper limit due to the unknown contribution of quasars to Ṅion. At z = 6, the measurement of Ṅion becomes strongly dependent on the modelling of hydrogen reionisation, and our constraints should only be taken as a rough estimate. |
It is interesting to compare our constraints with the model of Muñoz et al. (2024), where ξion and fesc increase sharply towards fainter MUV, motivated by recent measurements with the James Webb Space Telescope (JWST) of ξion (Simmonds et al. 2023) and low-redshift fesc scaling relations (Chisholm et al. 2022). To do this, we reproduced their model and obtained the total Ṅion at z = 5 by integrating the ionising output of galaxies down to Mlim = −11. We then obtained the effective global ⟨fescξion⟩ by dividing Ṅion by the corresponding ρUV and plot the result in Fig. 1, shown as a light blue dashed line.
The model of Muñoz et al. (2024) violates the global constraints from the Lyman-α forest by almost an order of magnitude. In simple terms, our measurements come from dividing the number of ionising photons in the IGM (which is know from measurements of Γ) by the total UV emission of all galaxies in order to obtain the mean galaxy escaping emissivity (which is defined per unit UV emission). The galactic property scaling relations theorised by Muñoz et al. (2024) result in a mean escaping emissivity almost ten times higher, which is very strongly ruled out by our argument. We interpret this as signifying that not all assumptions in their model can be correct at once. An extensive discussion concerning the robustness of the various assumptions of their model can be found in Muñoz et al. (2024).
We repeated the calculation for Mlim = −17 and obtained log⟨fescξion⟩/erg Hz . This assumption corresponds to a scenario where only bright galaxies contribute to the UVB, with a complete cut-off at Mlim. A nice comparison can be made with the models of Matthee et al. (2022), who argue that bright Lyman-α emitters (LAEs) are sufficient to power reionisation. Our corresponding measurement is in slight tension (1 − 1.5σ) with their scenario.
For the interest of readers, we present constraints arising from the same argument at z = 4 and z = 6 but with the following strong caveats. At z = 4, a large fraction of Ṅion is attributable to luminous quasars whose own UVLF is increasing rapidly (Kulkarni et al. 2019; Finkelstein & Bagley 2022). In Eq. (2), Ṅion should be reduced by the same fraction in order to retrieve the effective ⟨fescξion⟩ arising from galaxies alone. To avoid making a guess as to the quasar contribution to Ṅion, we used the ρUV arising from the galaxy UVLF only (Bouwens et al. 2021). Under this assumption and using the value of Ṅion from Becker & Bolton (2013), our measurement becomes a stringent upper limit of log⟨fescξion⟩/erg Hz−1 < 24.36 at z = 4. If this value is exceeded, then the galaxies alone would over-ionise the IGM. The upper limit is not in tension with the model of Matthee et al. (2022) but implies a tension with the z ∼ 3 direct measurements of Pahl et al. (2021), which was also noted by those authors. The limit is also in strong tension with the model of Muñoz et al. (2024).
The same caveat concerning an unknown contribution from active galactic nuclei could potentially apply to our main result at z = 5 in light of recent studies suggesting a larger role of faint quasars in finishing hydrogen reionisation (Grazian et al. 2024; Madau et al. 2024). At the present time, it is not clear how this scenario can avoid overheating the IGM (D’Aloisio et al. 2017) or why the same faint quasars would not initiate the reionisation of helium, which is known to only get underway at z ≲ 4 (Gaikwad et al. 2021). A significant contribution of faint quasars would formally turn our measurements at z = 5 into upper limits, exacerbating the tension with the model of Muñoz et al. (2024); in that model, galaxies by themselves already over-ionise the Lyman-α forest by almost an order of magnitude.
At z = 6, we repeated the same process using the UVLF of Bouwens et al. (2021) and the measurement of Ṅion from Γ of Gaikwad et al. (2023). The calculation of Ṅion depends linearly on the measurement of λLyC, which differs significantly between current studies. To incorporate this uncertainty, we rescaled the value of Ṅion from Gaikwad et al. (2023) to use the more direct measurement of λLyC from Zhu et al. (2023), but we extended the uncertainties to include the −1σ limit of Gaikwad et al. (2023)’s self-consistent measurement of λLyC. We obtained log⟨fescξion⟩/erg Hz−1
 for Mlim = −11 and log⟨fescξion⟩/erg Hz
 for Mlim = −17. However, the measurement of Γ from the Lyman-α forest is far more model dependent at z = 6 than z = 5 due to ongoing hydrogen reionisation. While the independent determination of Davies et al. (2024b) is consistent with Gaikwad et al. (2023), a model of reionisation (and/or a fluctuating UVB) is fundamentally required for the inference. Therefore, we show the measurements at z = 6 as open points in Fig. 1. They are in fairly good agreement with measurements from individual galaxies and slightly above the LAE model from Matthee et al. (2022) at z ∼ 6.
4. Discussion
We have briefly considered the implications of our constraints on the average ionising escape fraction of galaxies at z = 5. Direct measurements at z ∼ 5 have yielded population-averaged values of the emissivity of ξion ∼ 25.3 (see, e.g., Simmonds et al. 2024; Stefanon et al. 2022 and references therein). If this value holds for the entire galaxy population, our constraints from the Lyman-α forest require a population-averaged escape fraction of  . For a higher average ξion ∼ 25.5, as has been reported by some studies (e.g. Bouwens et al. 2016; Harikane et al. 2018), the escape fraction needs to be even lower in order to avoid making the forest too transmissive:
  . If the production of ionising photons is limited to bright LAEs with MUV < −17, as in the model of Matthee et al. (2022), they would require an
  assuming a ξion = 25.5. Later, at z = 4, the global escape fraction is stringently required to be fesc < 15%. Any contribution to the UV ionising background from active galactic nuclei at these redshifts would lower the required global galaxy escape fraction.
An escape fraction of ∼10% is similar to the initial predictions of the ionising photon budget required for star-forming galaxies to reionise the Universe (Robertson et al. 2013, 2015). While galaxies observed by JWST at very early times do indeed show signs of elevated ionising photon production and/or escape, it is important to point out that reionisation must have a ‘soft landing’ at ≲5.3. Theories of the ionising photon production of early galaxies (and quasars) need to be reconciled with the effects they would have on the z = 5 post-reionisation IGM – where the total Ṅion is already known robustly from observing the IGM itself.
The argument in this paper is not new; it has appeared in a similar form in, for e example Madau (2017), Shull et al. (2012), Kuhlen & Faucher-Giguère (2012). Theoretical models of the IGM have often implicitly incorporated the constraint on Ṅion coming from measurements of Γ (see, e.g., Kakiichi et al. 2018 and Davies et al. 2021). In contrast with these previous studies, we wished to directly present up-to-date constraints on the more familiar quantity ⟨fescξion⟩, which is of particular interest in light of ongoing observations of z > 5 galaxies with the JWST (e.g. Saxena et al. 2024; Torralba-Torregrosa et al. 2024; Protušová et al., in prep.).
Acknowledgments
We thank the anonymous referee for their insightful comments which helped direct the discussion in the manuscript. The idea for this analysis came from productive discussions with Koki Kakiichi and others at the NORDITA workshop programme “Cosmic Dawn at High Latitudes”. SEIB is supported by the Deutsche Forschungsgemeinschaft (DFG) under Emmy Noether grant number BO5771/1-1.
References
- Becker, G. D., & Bolton, J. S. 2013, MNRAS, 436, 1023 [Google Scholar]
- Becker, G. D., D’Aloisio, A., Christenson, H. M., et al. 2021, MNRAS, 508, 1853 [NASA ADS] [CrossRef] [Google Scholar]
- Bosman, S. E. I., Davies, F. B., Becker, G. D., et al. 2022, MNRAS, 514, 55 [NASA ADS] [CrossRef] [Google Scholar]
- Bouwens, R. J., Smit, R., Labbé, I., et al. 2016, ApJ, 831, 176 [Google Scholar]
- Bouwens, R. J., Oesch, P. A., Stefanon, M., et al. 2021, AJ, 162, 47 [NASA ADS] [CrossRef] [Google Scholar]
- Bouwens, R. J., Illingworth, G., Ellis, R. S., Oesch, P., & Stefanon, M. 2022, ApJ, 940, 55 [NASA ADS] [CrossRef] [Google Scholar]
- Chisholm, J., Saldana-Lopez, A., Flury, S., et al. 2022, MNRAS, 517, 5104 [CrossRef] [Google Scholar]
- D’Aloisio, A., Upton Sanderbeck, P. R., McQuinn, M., Trac, H., & Shapiro, P. R. 2017, MNRAS, 468, 4691 [CrossRef] [Google Scholar]
- D’Aloisio, A., McQuinn, M., Davies, F. B., & Furlanetto, S. R. 2018, MNRAS, 473, 560 [CrossRef] [Google Scholar]
- Davies, F. B., Bosman, S. E. I., Furlanetto, S. R., Becker, G. D., & D’Aloisio, A. 2021, ApJ, 918, L35 [NASA ADS] [CrossRef] [Google Scholar]
- Davies, F. B., Bosman, S. E. I., & Furlanetto, S. R. 2024a, ArXiv e-prints [arXiv:2406.18186] [Google Scholar]
- Davies, F. B., Bosman, S. E. I., Gaikwad, P., et al. 2024b, ApJ, 965, 134 [NASA ADS] [CrossRef] [Google Scholar]
- Finkelstein, S. L., & Bagley, M. B. 2022, ApJ, 938, 25 [NASA ADS] [CrossRef] [Google Scholar]
- Finkelstein, S. L., Ryan, R. E., Jr, Papovich, C., et al. 2015, ApJ, 810, 71 [NASA ADS] [CrossRef] [Google Scholar]
- Finkelstein, S. L., Leung, G. C. K., Bagley, M. B., et al. 2024, ApJ, 969, L2 [NASA ADS] [CrossRef] [Google Scholar]
- Gaikwad, P., Srianand, R., Haehnelt, M. G., & Choudhury, T. R. 2021, MNRAS, 506, 4389 [NASA ADS] [CrossRef] [Google Scholar]
- Gaikwad, P., Haehnelt, M. G., Davies, F. B., et al. 2023, MNRAS, 525, 4093 [NASA ADS] [CrossRef] [Google Scholar]
- Grazian, A., Giallongo, E., Boutsia, K., et al. 2024, ApJ, submitted [arXiv:2407.20861] [Google Scholar]
- Harikane, Y., Ouchi, M., Shibuya, T., et al. 2018, ApJ, 859, 84 [NASA ADS] [CrossRef] [Google Scholar]
- Jaskot, A. E., Silveyra, A. C., Plantinga, A., et al. 2024a, ApJ, 972, 92 [NASA ADS] [CrossRef] [Google Scholar]
- Jaskot, A. E., Silveyra, A. C., Plantinga, A., et al. 2024b, ApJ, submitted [arXiv:2406.10179] [Google Scholar]
- Kakiichi, K., Ellis, R. S., Laporte, N., et al. 2018, MNRAS, 479, 43 [NASA ADS] [CrossRef] [Google Scholar]
- Kuhlen, M., & Faucher-Giguère, C.-A. 2012, MNRAS, 423, 862 [NASA ADS] [CrossRef] [Google Scholar]
- Kulkarni, G., Worseck, G., & Hennawi, J. F. 2019, MNRAS, 488, 1035 [Google Scholar]
- Madau, P. 2017, ApJ, 851, 50 [NASA ADS] [CrossRef] [Google Scholar]
- Madau, P., Haardt, F., & Rees, M. J. 1999, ApJ, 514, 648 [CrossRef] [Google Scholar]
- Madau, P., Giallongo, E., Grazian, A., & Haardt, F. 2024, ApJ, 971, 75 [NASA ADS] [CrossRef] [Google Scholar]
- Mason, C. A., & Gronke, M. 2020, MNRAS, 499, 1395 [Google Scholar]
- Matthee, J., Naidu, R. P., Pezzulli, G., et al. 2022, MNRAS, 512, 5960 [NASA ADS] [CrossRef] [Google Scholar]
- Meiksin, A., & White, M. 2003, MNRAS, 342, 1205 [CrossRef] [Google Scholar]
- Meyer, R. A., Bosman, S. E. I., Kakiichi, K., & Ellis, R. S. 2019, MNRAS, 483, 19 [NASA ADS] [CrossRef] [Google Scholar]
- Meyer, R. A., Kakiichi, K., Bosman, S. E. I., et al. 2020, MNRAS, 494, 1560 [Google Scholar]
- Muñoz, J. B., Mirocha, J., Chisholm, J., Furlanetto, S. R., & Mason, C. 2024, MNRAS, submitted [arXiv:2404.07250] [Google Scholar]
- Pahl, A. J., Shapley, A., Steidel, C. C., Chen, Y., & Reddy, N. A. 2021, MNRAS, 505, 2447 [NASA ADS] [CrossRef] [Google Scholar]
- Rinaldi, P., Caputi, K. I., Iani, E., et al. 2024, ApJ, 969, 12 [NASA ADS] [CrossRef] [Google Scholar]
- Robertson, B. E., Furlanetto, S. R., Schneider, E., et al. 2013, ApJ, 768, 71 [Google Scholar]
- Robertson, B. E., Ellis, R. S., Furlanetto, S. R., & Dunlop, J. S. 2015, ApJ, 802, L19 [Google Scholar]
- Saxena, A., Bunker, A. J., Jones, G. C., et al. 2024, A&A, 684, A84 [NASA ADS] [CrossRef] [EDP Sciences] [Google Scholar]
- Shull, J. M., Harness, A., Trenti, M., & Smith, B. D. 2012, ApJ, 747, 100 [CrossRef] [Google Scholar]
- Simmonds, C., Tacchella, S., Maseda, M., et al. 2023, MNRAS, 523, 5468 [NASA ADS] [CrossRef] [Google Scholar]
- Simmonds, C., Tacchella, S., Hainline, K., et al. 2024, MNRAS, 527, 6139 [Google Scholar]
- Stefanon, M., Bouwens, R. J., Illingworth, G. D., et al. 2022, ApJ, 935, 94 [NASA ADS] [CrossRef] [Google Scholar]
- Tang, M., Stark, D. P., Chevallard, J., & Charlot, S. 2019, MNRAS, 489, 2572 [NASA ADS] [CrossRef] [Google Scholar]
- Torralba-Torregrosa, A., Matthee, J., Naidu, R. P., et al. 2024, A&A, 689, A44 [NASA ADS] [CrossRef] [EDP Sciences] [Google Scholar]
- Worseck, G., Prochaska, J. X., O’Meara, J. M., et al. 2014, MNRAS, 445, 1745 [NASA ADS] [CrossRef] [Google Scholar]
- Zhu, Y., Becker, G. D., Christenson, H. M., et al. 2023, ApJ, 955, 115 [CrossRef] [Google Scholar]
All Figures
|
Fig. 1. Measurements of ⟨fescξion⟩ across redshift. Our constraints based on ρUV and Ṅion are shown for two different Mlim (black). For comparison, we show measurements from the galaxy-optical depth cross-correlation (Meyer et al. 2019, 2020), direct detections of the Lyman continuum (Pahl et al. 2021), and indirect fesc and ξion tracers (Saxena et al. 2024; Rinaldi et al. 2024; Torralba-Torregrosa et al. 2024). The implications of the LAE-driven reionisation model of Matthee et al. (2022) as well as the models of Muñoz et al. (2024) and Davies et al. (2021) are shown in shades of blue. At z = 4, our argument only produces an upper limit due to the unknown contribution of quasars to Ṅion. At z = 6, the measurement of Ṅion becomes strongly dependent on the modelling of hydrogen reionisation, and our constraints should only be taken as a rough estimate. |
| In the text | |
Current usage metrics show cumulative count of Article Views (full-text article views including HTML views, PDF and ePub downloads, according to the available data) and Abstracts Views on Vision4Press platform.
Data correspond to usage on the plateform after 2015. The current usage metrics is available 48-96 hours after online publication and is updated daily on week days.
Initial download of the metrics may take a while.