Fig. 3.

Download original image
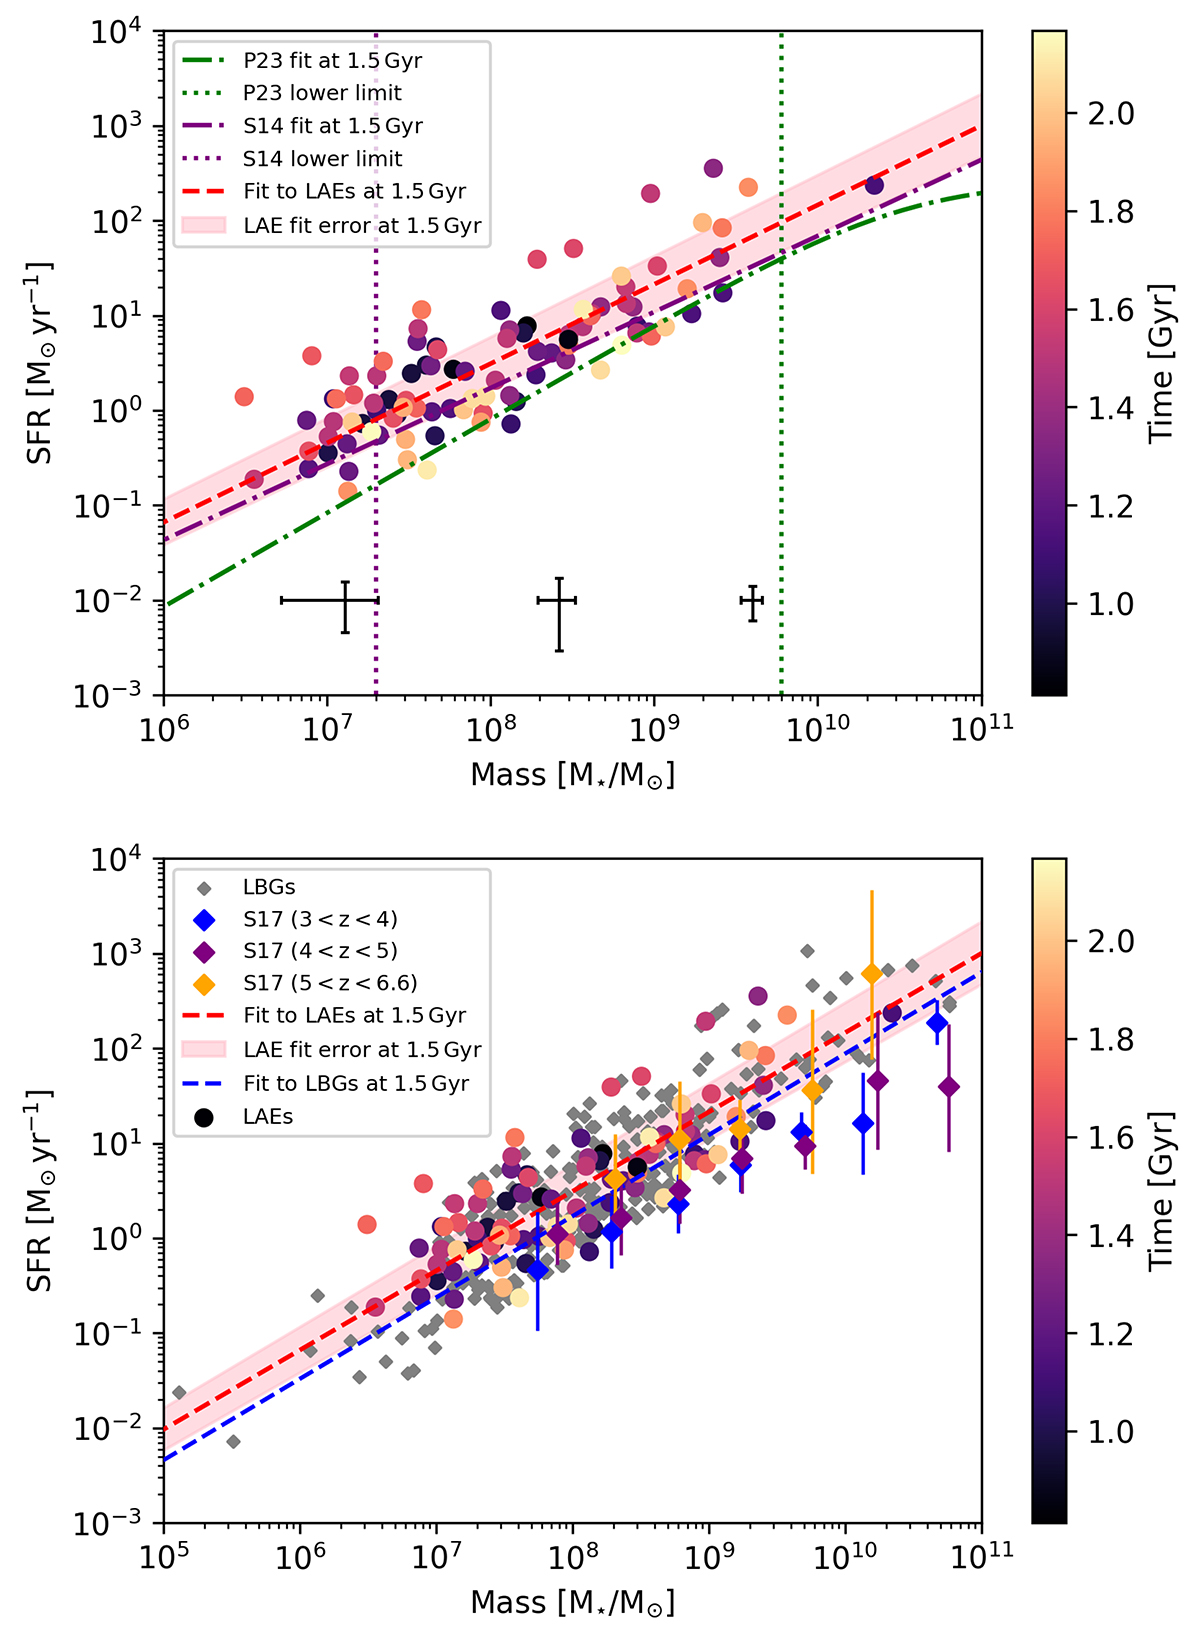
Stellar mass vs SFR: the galaxy MS. Upper panel: 96 LAEs in our final sample plotted on the star-forming MS, together with the best fits to the data of P23, S14 and the best fit to the LAEs following Eq. (1). LAEs are colour-coded by as ‘Time’, in Gyr, which is the age of the Universe at the observed redshift. The purple, dotted line indicates the lowest-stellar mass limit of S14’s review (2 × 10⁷ M⊙) and the green, dotted line indicates the lowest-stellar mass limit of P23’s review (6 × 10⁹ M⊙). The pink shaded area denotes the ±1σ area for the best-fit MS relation at the sample mean age, ∼1.48 Gyr. The mean error bars in three mass bins (106 < M/M⊙ < 2.5 × 10⁷, 2.5 × 10⁷ < M⋆/M⊙ < 5 × 10⁸ and 5 × 10⁸ < M⋆/M⊙ < 1010) are shown in black at the bottom of the plot. Lower: same LAEs and best-fit relation, but compared this time to the results in the same mass range that have been UV-selected, namely: the LBGs from A2744 from Goovaerts et al. (2023) as grey diamonds, with a blue best-fit relation, and the mass-binned results from S17 as coloured diamonds with error bars.
Current usage metrics show cumulative count of Article Views (full-text article views including HTML views, PDF and ePub downloads, according to the available data) and Abstracts Views on Vision4Press platform.
Data correspond to usage on the plateform after 2015. The current usage metrics is available 48-96 hours after online publication and is updated daily on week days.
Initial download of the metrics may take a while.


