Fig. 9
Download original image
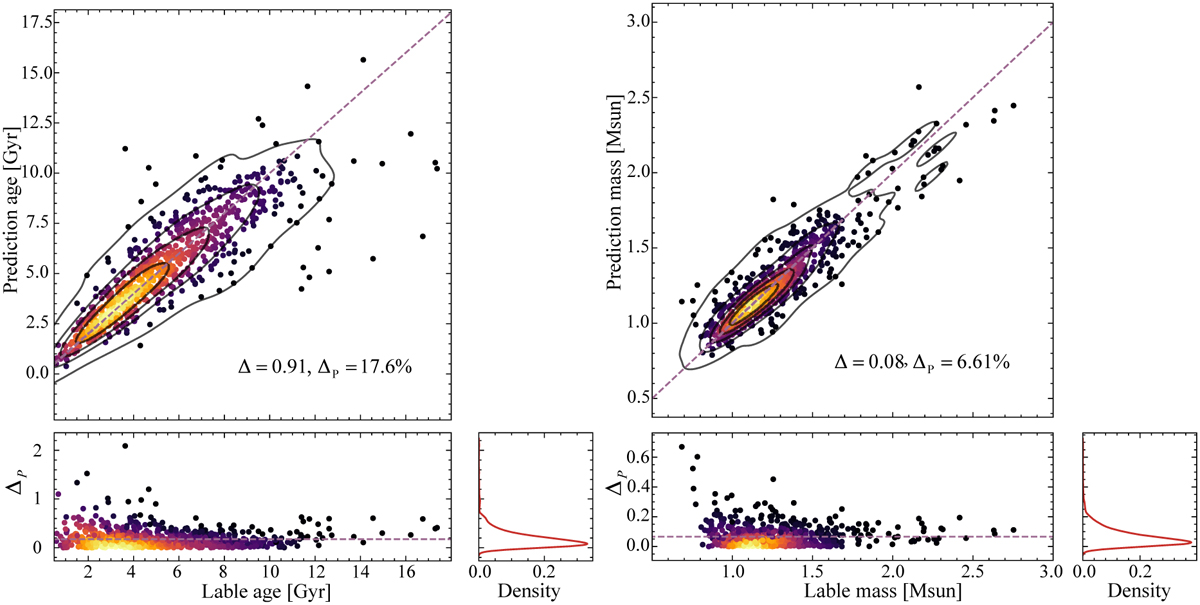
Regression results for age and mass of red giants. The upper sections of each panel display kernel density plots of predicted values versus true labels, where a yellower color indicates higher density, signifying more concentrated data; the dashed lines represent the identity line, while the black lines indicate isohypse. Also, Δ and ΔP represent the mean absolute error and mean absolute percentage error, respectively. The lower sections show scatter plots and distribution graphs for ΔP (with the red line). The scatter plots demonstrate the error of the predictive model at each data point, with the color-density relationship consistent with the upper panels; the dashed lines denote the average value of ΔP, providing a reference for the overall error level. The distribution graphs illustrate the spread of ΔP across the entire dataset. “Density” is the probability density fitted to the ΔP. Left panel: regression results for ages with an average absolute error Δ of 0.91 dex and ΔP of 17.64%. Right panel: regression results for masses with Δ and ΔP values of 0.08 dex and 6.61%, respectively.
Current usage metrics show cumulative count of Article Views (full-text article views including HTML views, PDF and ePub downloads, according to the available data) and Abstracts Views on Vision4Press platform.
Data correspond to usage on the plateform after 2015. The current usage metrics is available 48-96 hours after online publication and is updated daily on week days.
Initial download of the metrics may take a while.