Fig. 11
Download original image
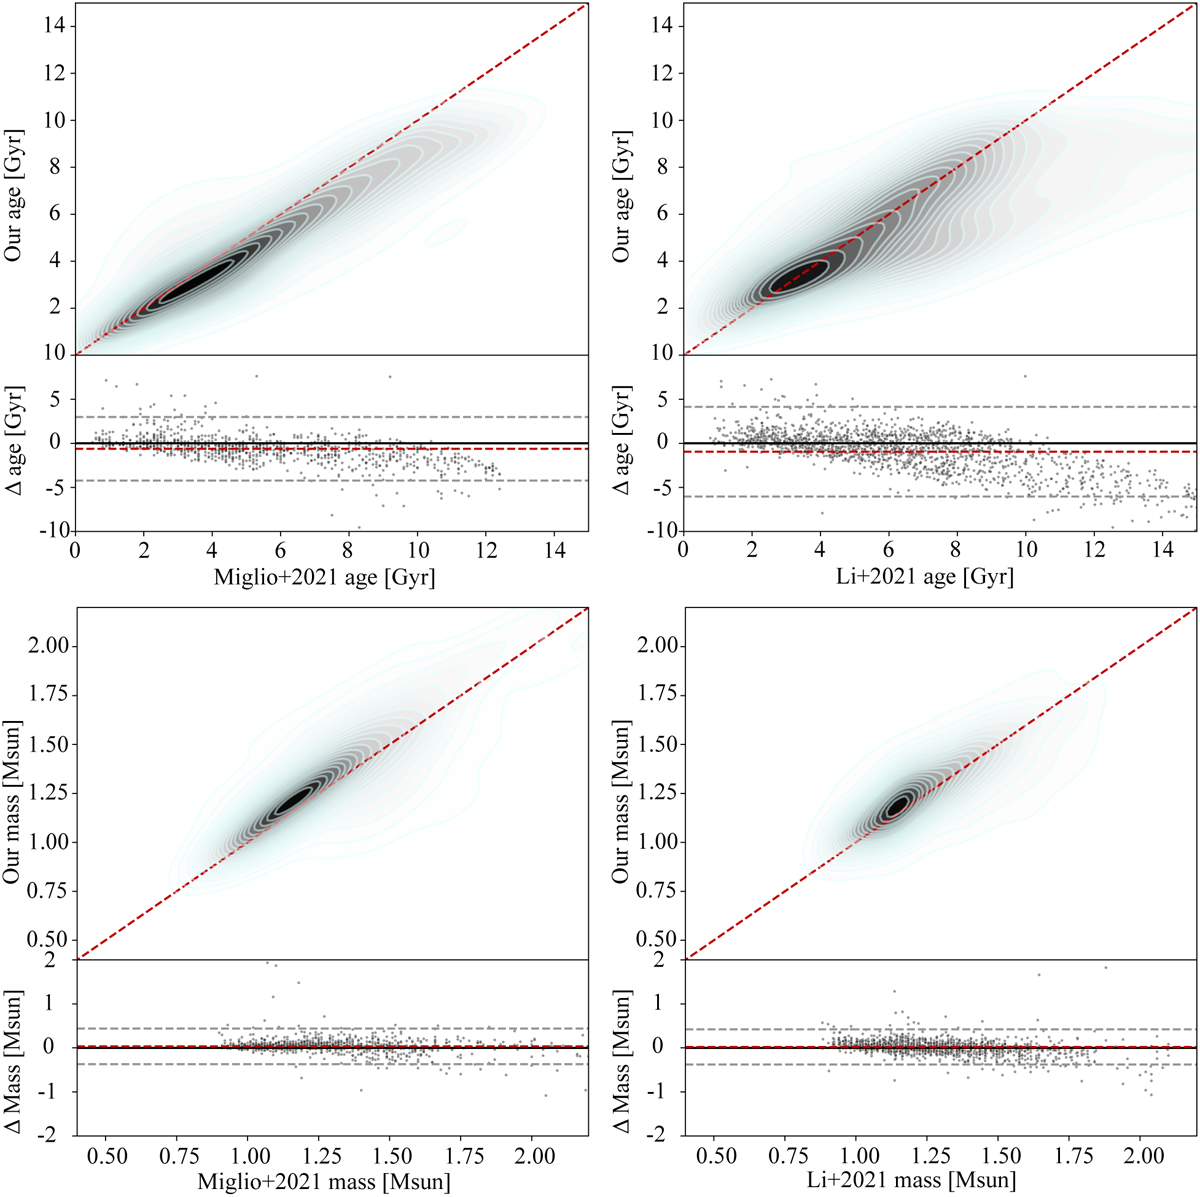
Comparison of age and mass predictions for red giants using various asteroseismic methods. Top-left panel: comparison of age predictions with Miglio et al. (2021). Top-right panel: comparison of age predictions with Li et al. (2022). Bottom panels: mass predictions comparisons akin to top panels. The upper sections of each panel display kernel density plots related to age or mass as compared with asteroseismic methods, with darker colors indicating higher densities; red dashed lines represent the identity line, while the light cyan lines indicate isohypse. The lower sections depict residuals, with gray points showing the deviations between our model and the asteroseismic benchmarks. A horizontal red dashed line indicates the mean residual, serving as an indicator of overall bias. Two gray dashed lines outline the 95% consistency boundaries.
Current usage metrics show cumulative count of Article Views (full-text article views including HTML views, PDF and ePub downloads, according to the available data) and Abstracts Views on Vision4Press platform.
Data correspond to usage on the plateform after 2015. The current usage metrics is available 48-96 hours after online publication and is updated daily on week days.
Initial download of the metrics may take a while.