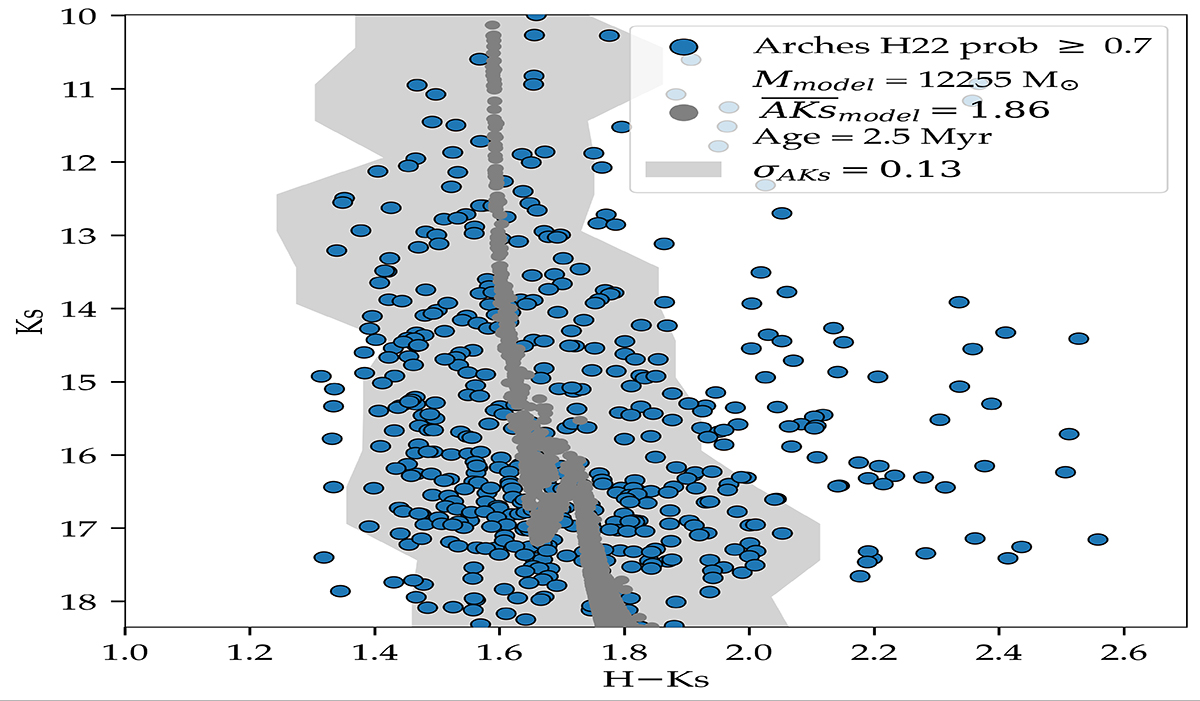
Fig. 6.
Download original image
Arches cluster versus simulated cluster: CMD comparison. The blue dots represent the members of the Arches cluster, while the gray dots represent a simulated cluster with an age of 2.5 Myr. The mean extinction is given by AKs = 1.85. The shaded area in the plot represents the uncertainty in the position of the model members in the CMD due to differential extinction, σAks.
Current usage metrics show cumulative count of Article Views (full-text article views including HTML views, PDF and ePub downloads, according to the available data) and Abstracts Views on Vision4Press platform.
Data correspond to usage on the plateform after 2015. The current usage metrics is available 48-96 hours after online publication and is updated daily on week days.
Initial download of the metrics may take a while.