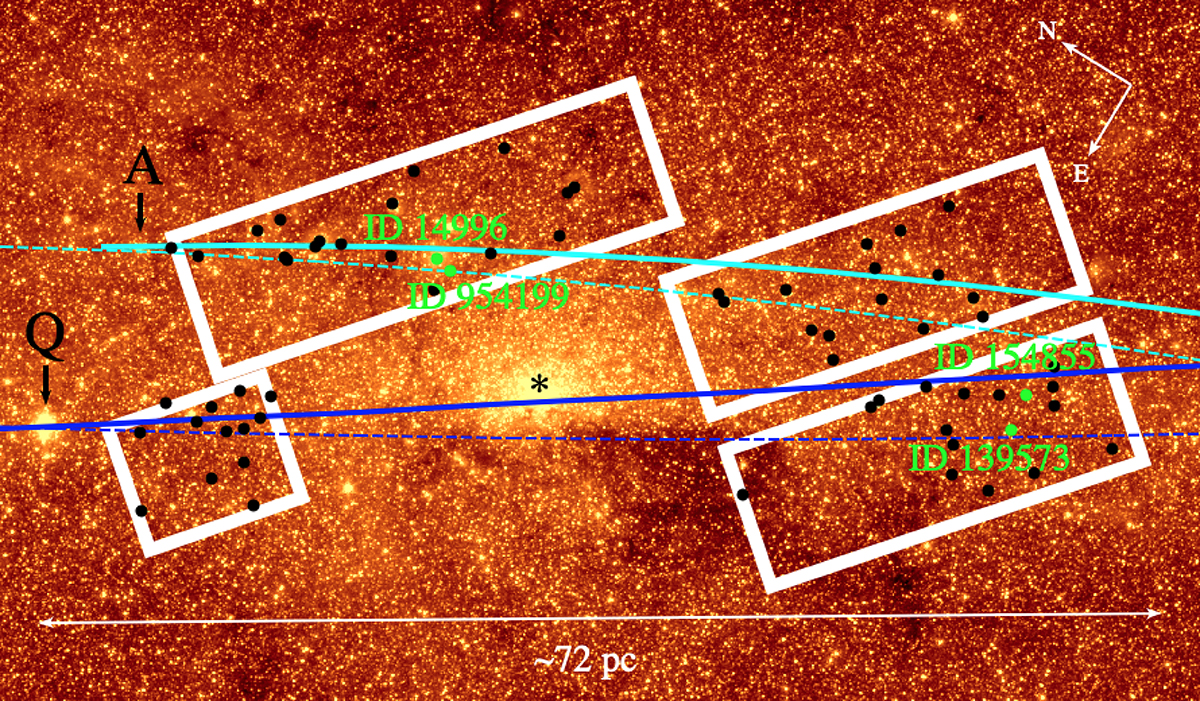
Fig. 1.
Download original image
Survey coverage, cluster orbits, and massive star distribution in the GC. Regions covered by Libralato et al. (2021; indicated by white boxes) are superimposed on a 4.5 μm Spitzer/IRAC image (Stolovy et al. 2006). The cyan and blue lines represent the most probable prograde orbits of the Arches and Quintuplet clusters, respectively, as determined by Hosek et al. (2022). The continuous line indicates movement toward the Galactic east (in front of the plane of the sky), while the dashed line indicates movement toward the Galactic west (behind the plane of the sky). The plotted points correspond to massive stars identified by Dong et al. (2011) for which proper motion data are available. Among these stars, the green points are associated with a co-moving group, and their ID numbers correspond to their index as listed in Libralato et al. (2021). The letters A and Q and the asterisk denote the positions of the Arches and Quintuplet clusters and SgrA*.
Current usage metrics show cumulative count of Article Views (full-text article views including HTML views, PDF and ePub downloads, according to the available data) and Abstracts Views on Vision4Press platform.
Data correspond to usage on the plateform after 2015. The current usage metrics is available 48-96 hours after online publication and is updated daily on week days.
Initial download of the metrics may take a while.