Fig. 3
Download original image
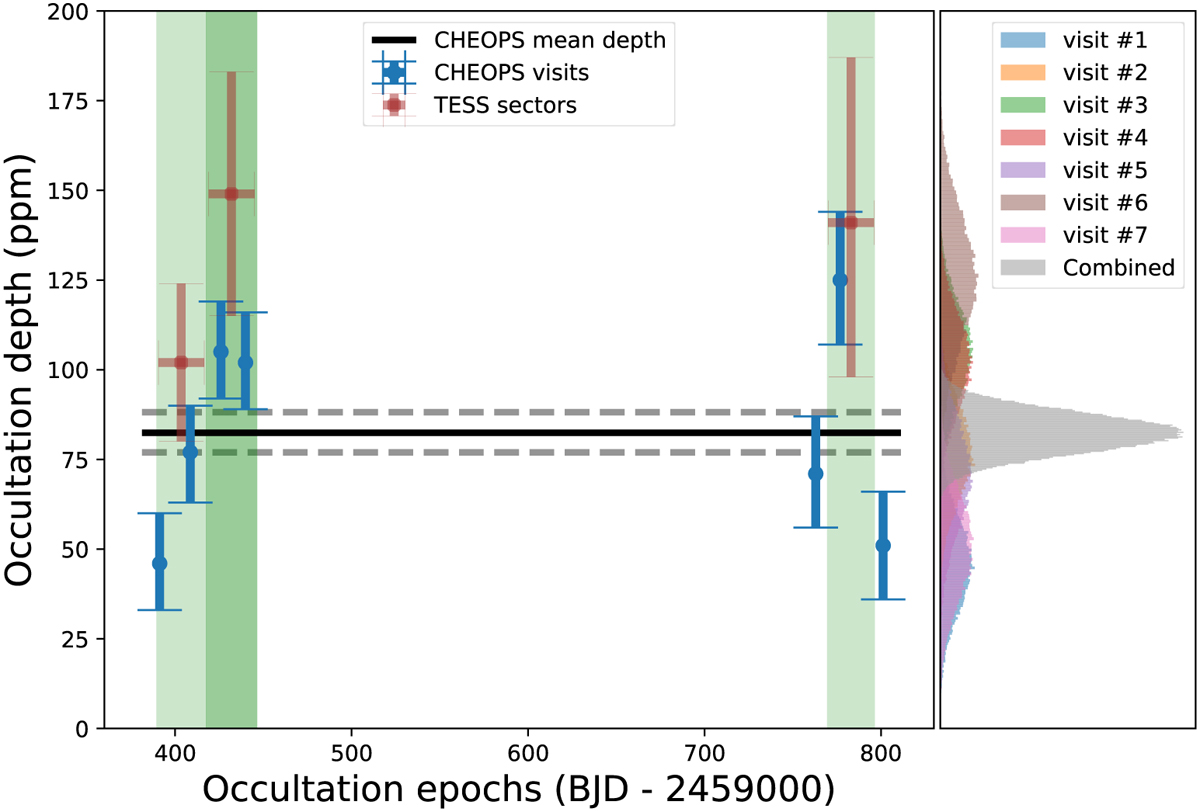
Best-fit occultation depths of individual CHEOPS visits (blue) along with their posteriors in the right panel. The horizontal solid and dashed lines represent the mean occultation depth of 82.4 ± 5.6 ppm. The green shaded regions indicate the span of the TESS Sectors 40, 41, and 54, while the brown points indicate the sector-wise occultation depths.
Current usage metrics show cumulative count of Article Views (full-text article views including HTML views, PDF and ePub downloads, according to the available data) and Abstracts Views on Vision4Press platform.
Data correspond to usage on the plateform after 2015. The current usage metrics is available 48-96 hours after online publication and is updated daily on week days.
Initial download of the metrics may take a while.