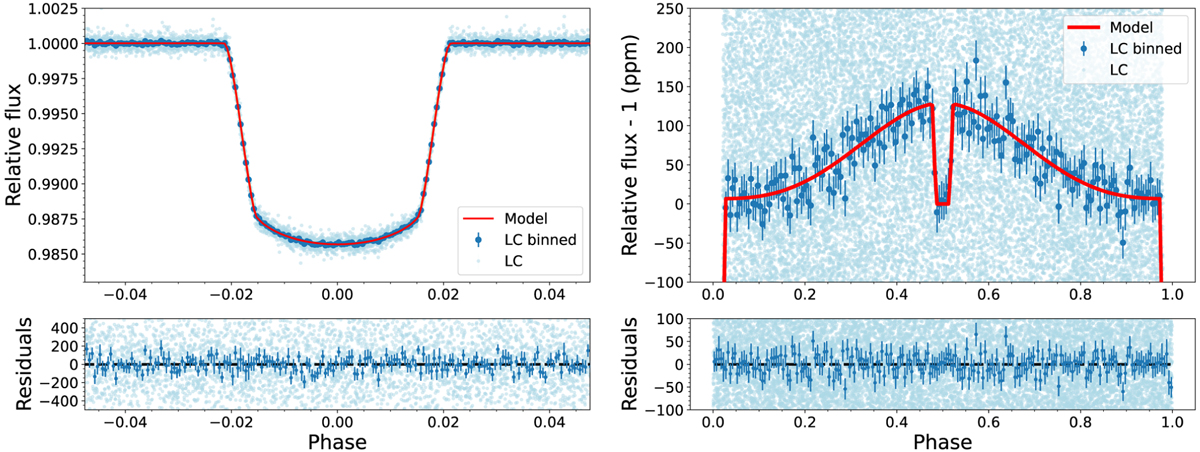
Fig. 2
Download original image
TESS light curve. Left: detrended and phase-folded planetary transits from Sectors 14, 40, 41, and 54. The solid red line is the best-fit model, while the blue dots represent the phase-folded and binned photometry (Interval: 2.25 min for transit, 25 min for phase curve). The residuals are shown in the bottom panel. Right: combined phase curve using photometry from all four sectors.
Current usage metrics show cumulative count of Article Views (full-text article views including HTML views, PDF and ePub downloads, according to the available data) and Abstracts Views on Vision4Press platform.
Data correspond to usage on the plateform after 2015. The current usage metrics is available 48-96 hours after online publication and is updated daily on week days.
Initial download of the metrics may take a while.