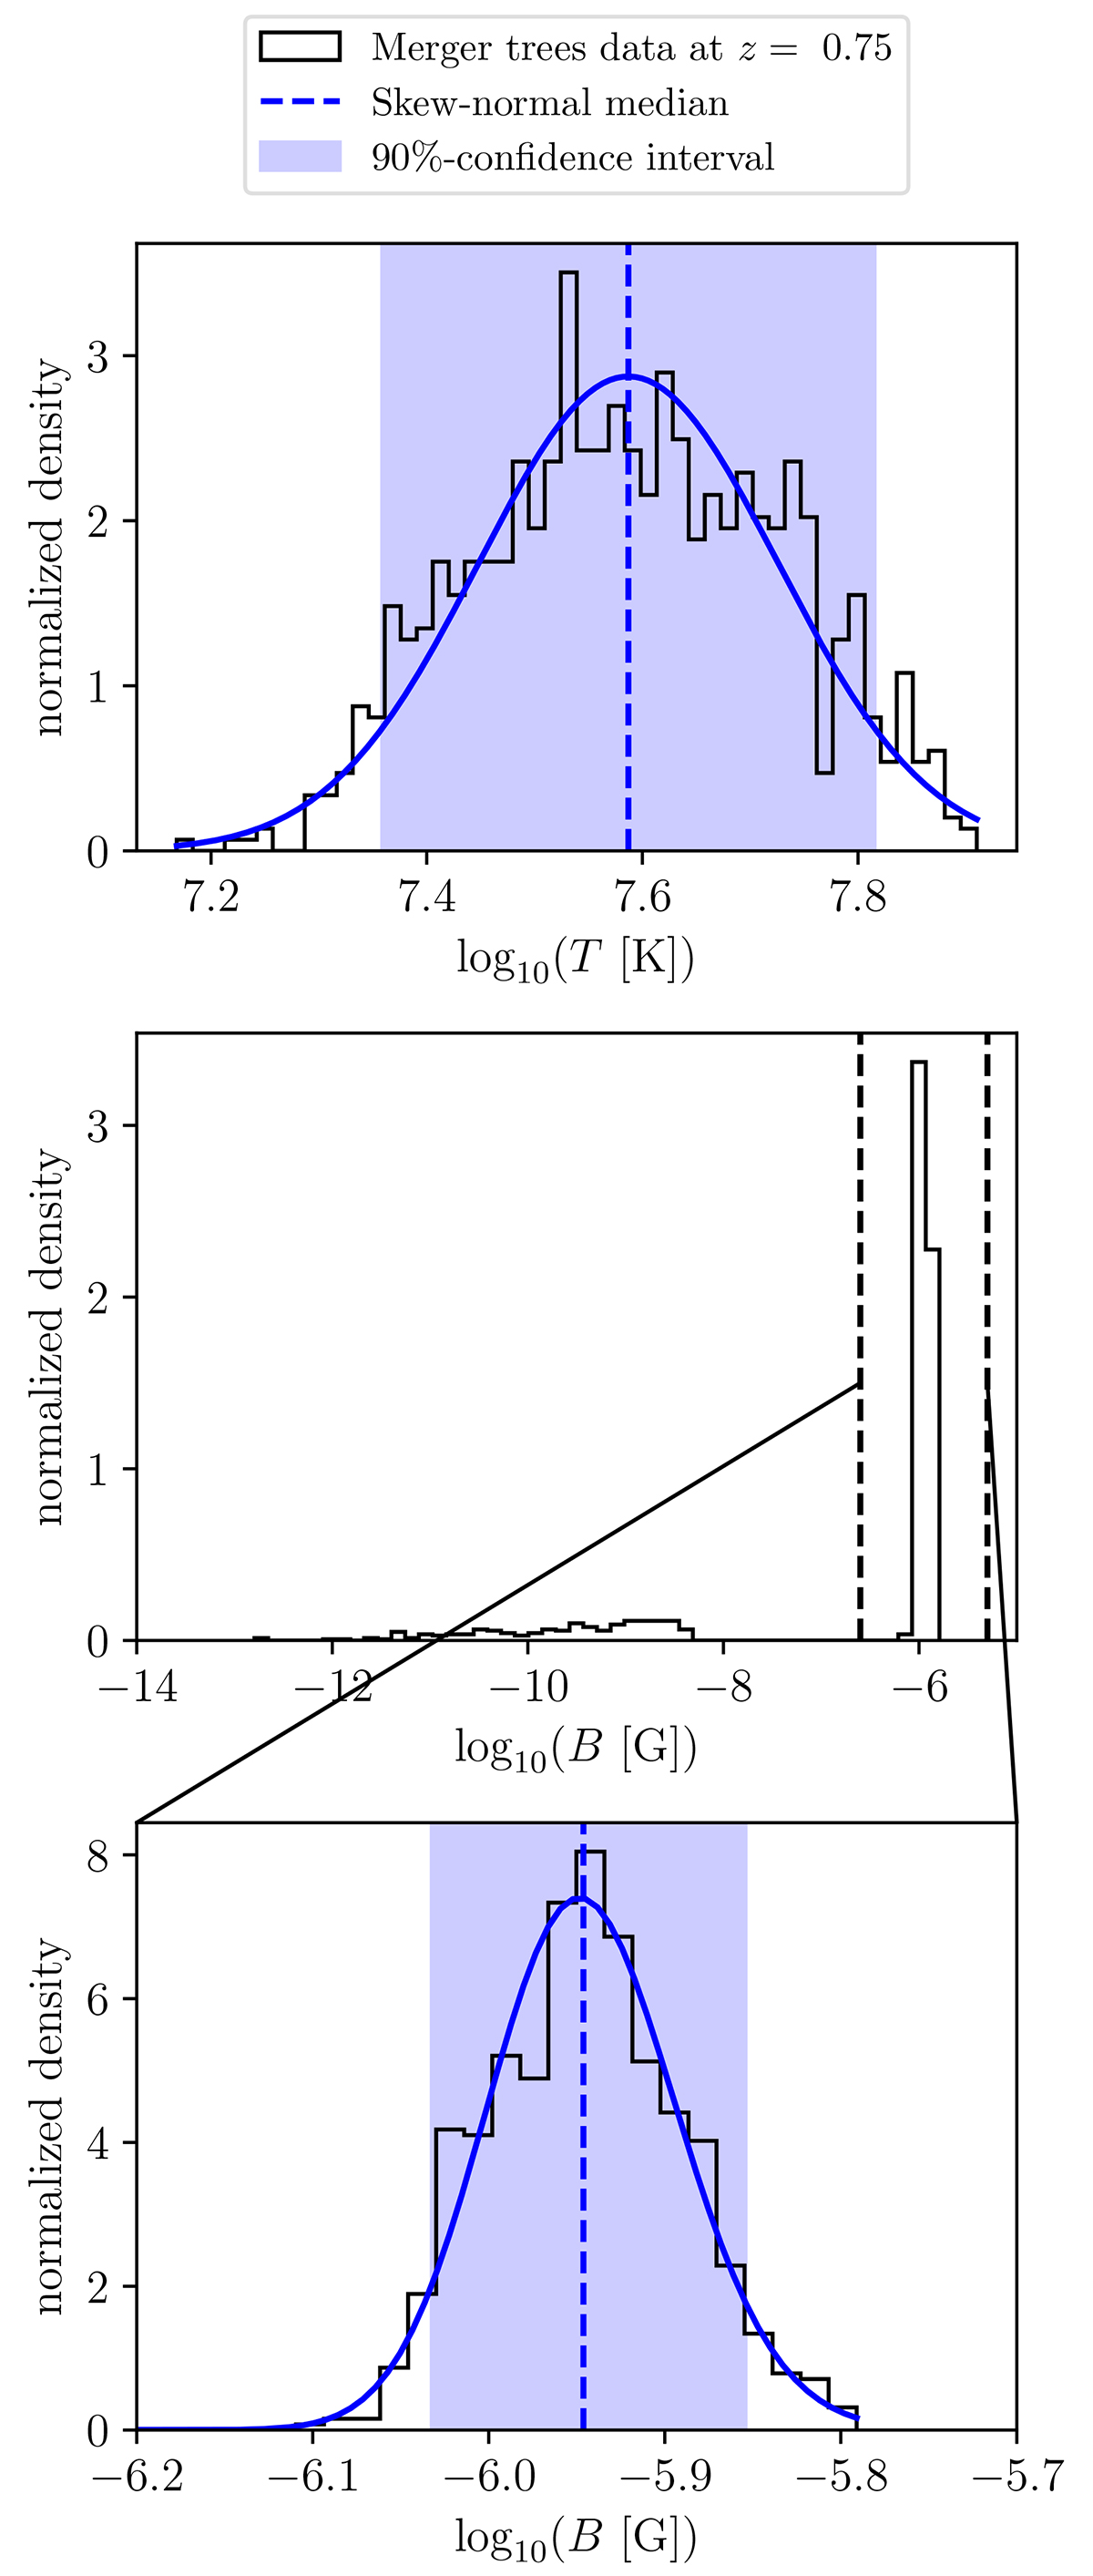
Fig. C.1.
Download original image
Illustration of our method using a skew-normal distribution to average different physical quantities at a given redshift, for many merger trees. (top) Distribution of the temperature values from all merger trees at redshift z = 0.75. The blue line represents the skew-normal distribution used to fit the data. The dashed line and the blue-shaded line, respectively, are the distribution’s median (that is used as an estimator for the average of all curves) and its corresponding 90% confidence interval. (middle) Distribution of magnetic field values at this same redshift. The two dashed black lines indicate the region that is fit with the skew-normal distribution. (bottom) Fitting within the region in the middle panel. Those three panels were computed with Reeff Model L, for log10(B0 [G]) = −20, α0 = 20, and zstart = 1.5.
Current usage metrics show cumulative count of Article Views (full-text article views including HTML views, PDF and ePub downloads, according to the available data) and Abstracts Views on Vision4Press platform.
Data correspond to usage on the plateform after 2015. The current usage metrics is available 48-96 hours after online publication and is updated daily on week days.
Initial download of the metrics may take a while.