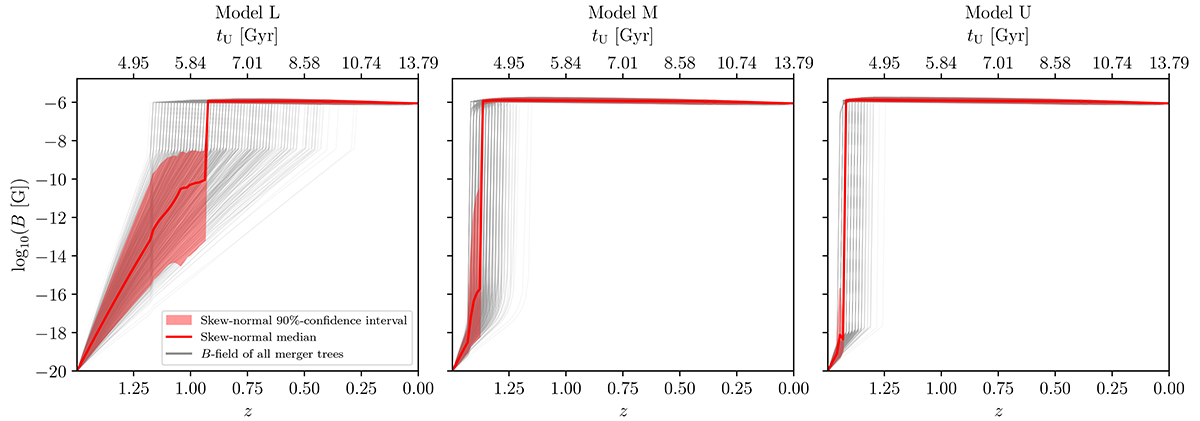
Fig. 3.
Download original image
Evolution of magnetic field for α0 = 20 and zstart = 1.5 and for the three models for the effective Reynolds number. The gray curves are the magnetic field evolution of all Ntree = 103 merger trees. The red curve indicates the average obtained by fitting all curves at each redshift value with a skew-normal distribution (see Appendix C). The colored area shows the 90% confidence interval for such a distribution. The age of the Universe tU at each redshift is plotted on the second x-axis.
Current usage metrics show cumulative count of Article Views (full-text article views including HTML views, PDF and ePub downloads, according to the available data) and Abstracts Views on Vision4Press platform.
Data correspond to usage on the plateform after 2015. The current usage metrics is available 48-96 hours after online publication and is updated daily on week days.
Initial download of the metrics may take a while.