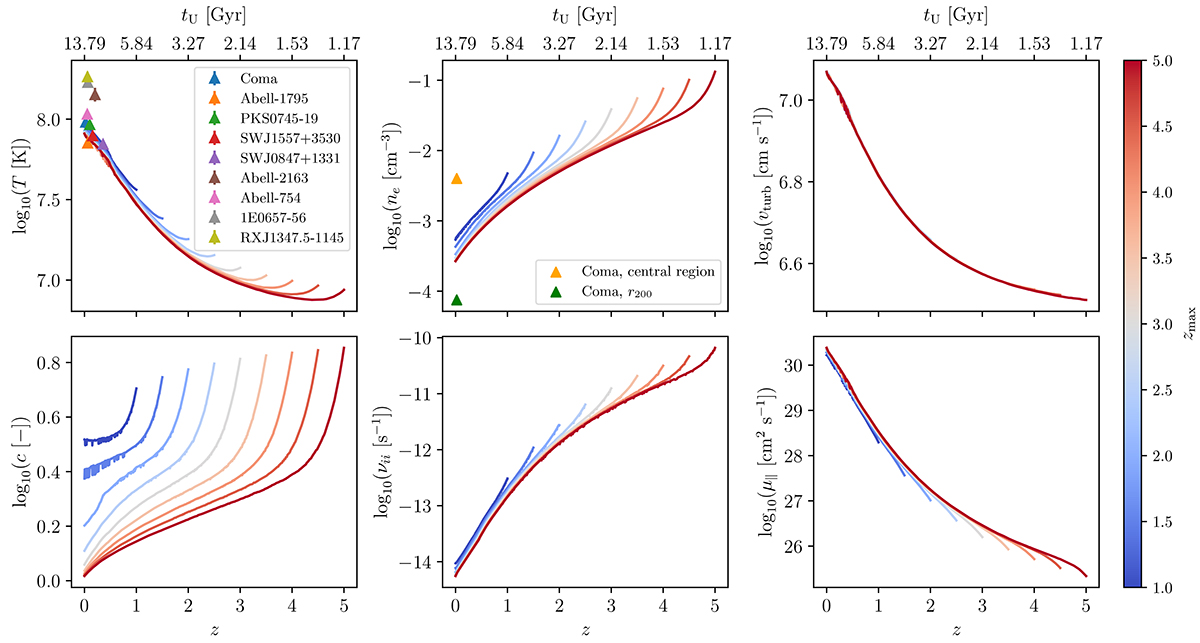
Fig. 2.
Download original image
Evolution of various plasma quantities as a function of redshift and for different values of zmax. Each curve represents the average value of the quantity over Ntree = 103 merger trees (see Appendix C) for which a redshift-dependent, one-dimensional profile has been calculated according to Eqs. (19) and (21). The age of the Universe tU at each redshift is plotted on the second x-axis. In order to assess the validity of our model, we added observed values for the temperature and the thermal electron density (see the detailed list in the main text).
Current usage metrics show cumulative count of Article Views (full-text article views including HTML views, PDF and ePub downloads, according to the available data) and Abstracts Views on Vision4Press platform.
Data correspond to usage on the plateform after 2015. The current usage metrics is available 48-96 hours after online publication and is updated daily on week days.
Initial download of the metrics may take a while.