Fig. 5.

Download original image
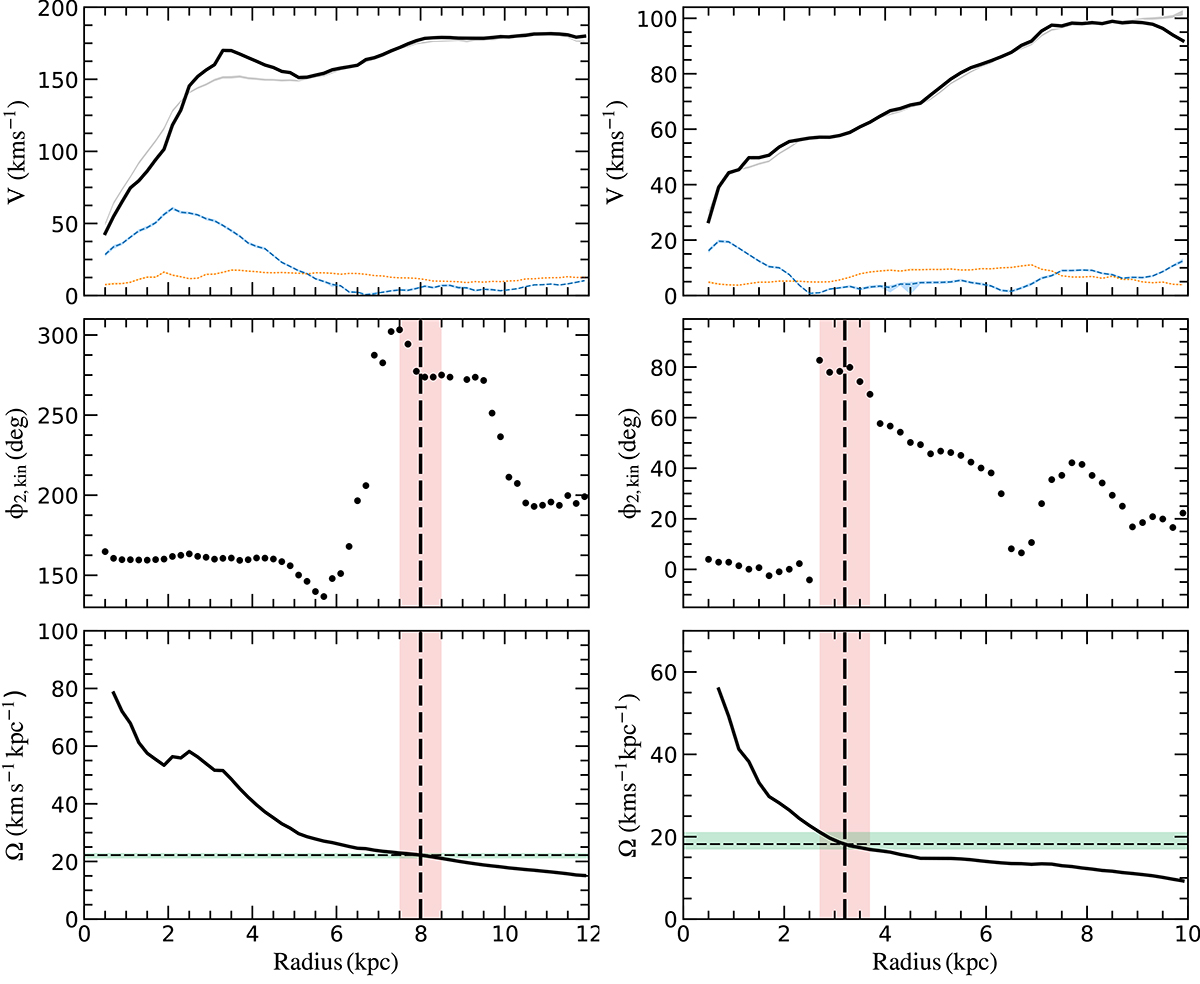
Results of the BV model of the stellar tangential velocity map of the B5 (left panels) and KRATOS (right panels) simulations: amplitude (upper panels), phase angle, ϕ2,kin of the Fourier modes (middle panels), and angular frequency Ω (bottom panels). In the top panels, the black solid line is the fitted axisymmetric velocity component V0 (the rotation curve), the grey line is the median velocity (initial value for the model), the blue dashed curve is the amplitude of the tangential bisymmetry V2, and the orange dotted line is the scatter of the model Vs. In the middle and bottom panels, the vertical light coral area and dashed line shows the adopted bar corotation radius, Rc = 8.0 ± 0.5 kpc for B5 and Rc = 3.3 ± 0.5 kpc for KRATOS simulations. In the bottom panel, the black solid line is the angular velocity derived from V0, while the horizontal green area and dotted line shows the corresponding bar pattern speed ![]() km s−1 kpc−1 and
km s−1 kpc−1 and ![]() km s−1 kpc−1, for the B5 and KRATOS simulations, respectively. Values are summarised, and compared with the reference values, in Table 1.
km s−1 kpc−1, for the B5 and KRATOS simulations, respectively. Values are summarised, and compared with the reference values, in Table 1.
Current usage metrics show cumulative count of Article Views (full-text article views including HTML views, PDF and ePub downloads, according to the available data) and Abstracts Views on Vision4Press platform.
Data correspond to usage on the plateform after 2015. The current usage metrics is available 48-96 hours after online publication and is updated daily on week days.
Initial download of the metrics may take a while.


