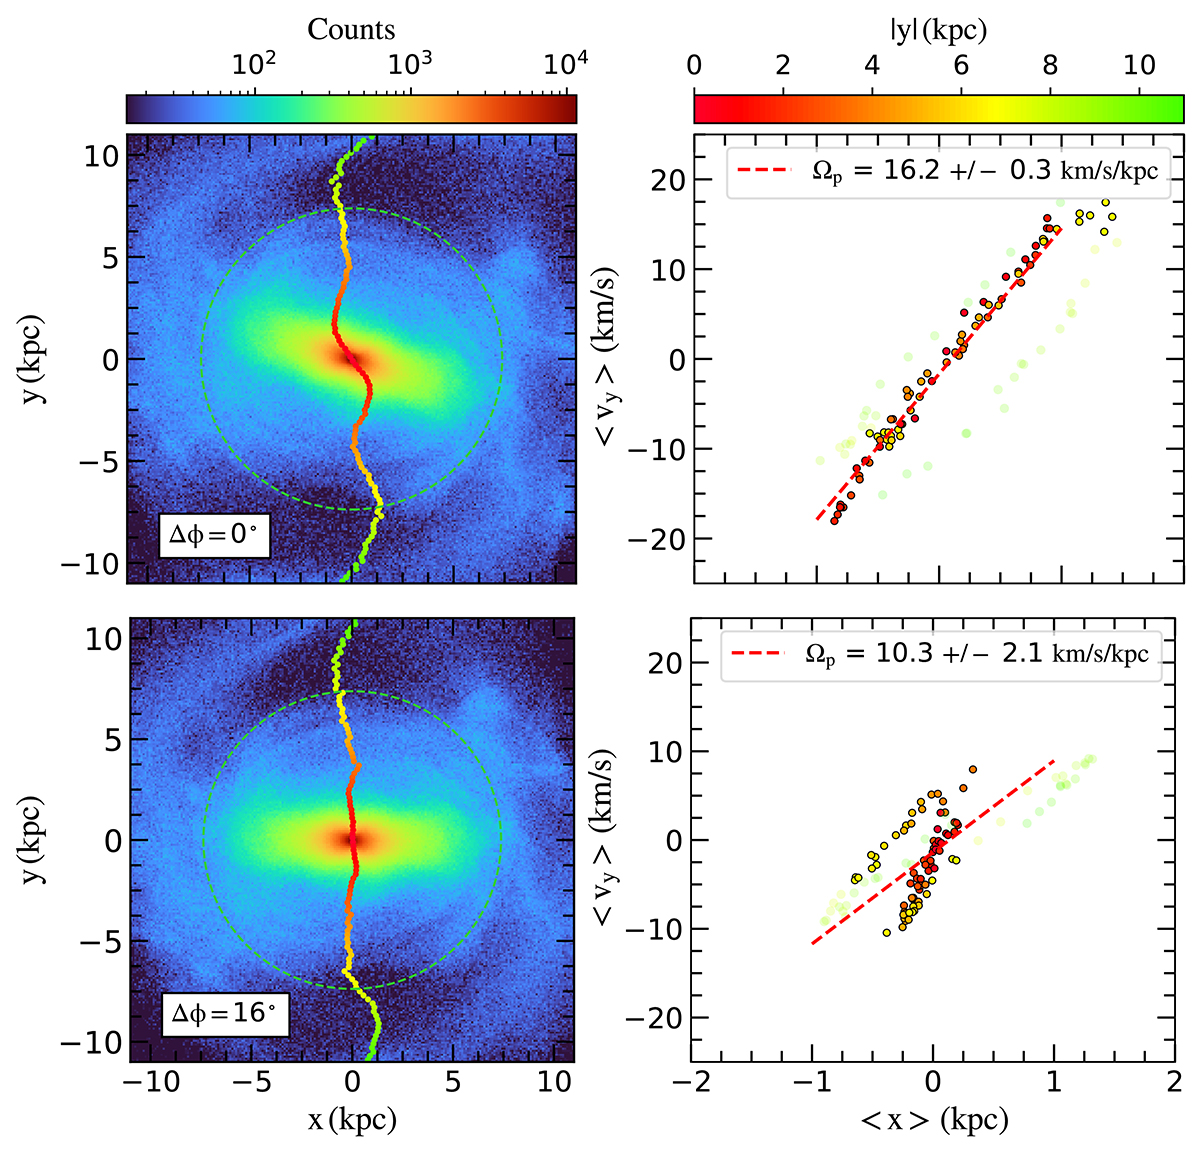
Fig. 3.

Download original image
Application of the IPTW method to B5 simulation. Top: bar major axis at ϕb = 163.5°, as in the original snapshot and shown in Fig. 1. Bottom: after applying a rotation of Δϕ = 16.5° to put the bar major axis along the x-axis. Left: surface density where the bar region (obtained using Dehnen method) is indicated by the green dashed circle. A scatter plot representing the value of ⟨x⟩ for each slice in y is overlapped. The scatter plot varies its colour as function of the distance to the centre in the y-axis, being the red points close to the centre and the green close to the external parts of the galaxy. Right: scatter plot of the Tremaine-Weinberg integrals ⟨x⟩ and ⟨vy⟩ for the different slices in the y-axis. The colour of the scatter plot is the same in both left and right panels. In the right panel, the points with a black circle are inside of the bar region and, therefore, the only considered for fitting Ωp.
Current usage metrics show cumulative count of Article Views (full-text article views including HTML views, PDF and ePub downloads, according to the available data) and Abstracts Views on Vision4Press platform.
Data correspond to usage on the plateform after 2015. The current usage metrics is available 48-96 hours after online publication and is updated daily on week days.
Initial download of the metrics may take a while.


