Fig. 2.

Download original image
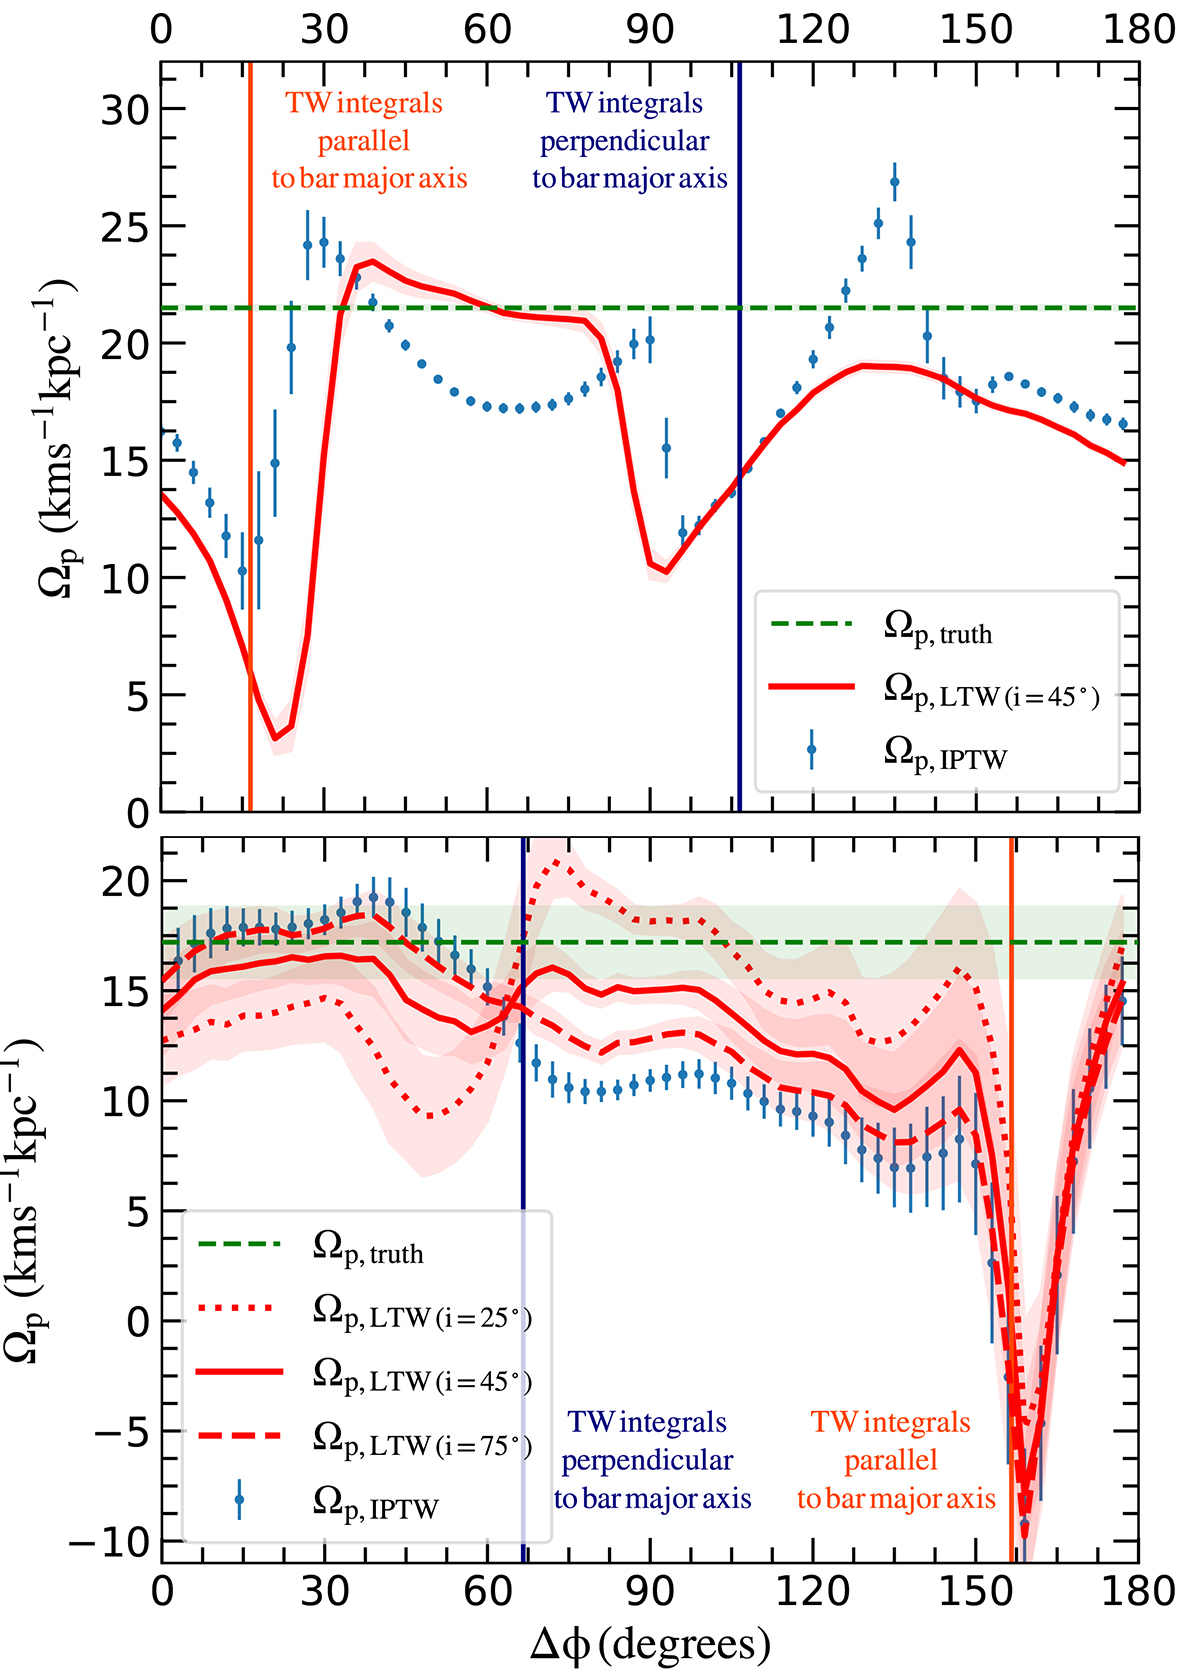
Variation of Ωp as as function of the reference frame orientation Δϕ. Results for the B5 and KRATOS simulations are shown in the upper and lower panels, respectively. Results of the IPTW method are shown as open symbols, while those of the LTW method are drawn as a solid line (for the i = 45° case, upper panel), and as dotted, solid and dashed lines (for the i = 25, 45 and 75° cases, lower panel). Horizontal dashed green lines are the ground-truth bar pattern speeds. The vertical orange (navy) vertical line corresponds to the frame orientation where the x-axis of the disc lies along the major axis of the bar (y-axis, respectively).
Current usage metrics show cumulative count of Article Views (full-text article views including HTML views, PDF and ePub downloads, according to the available data) and Abstracts Views on Vision4Press platform.
Data correspond to usage on the plateform after 2015. The current usage metrics is available 48-96 hours after online publication and is updated daily on week days.
Initial download of the metrics may take a while.


