Fig. 8.
Download original image
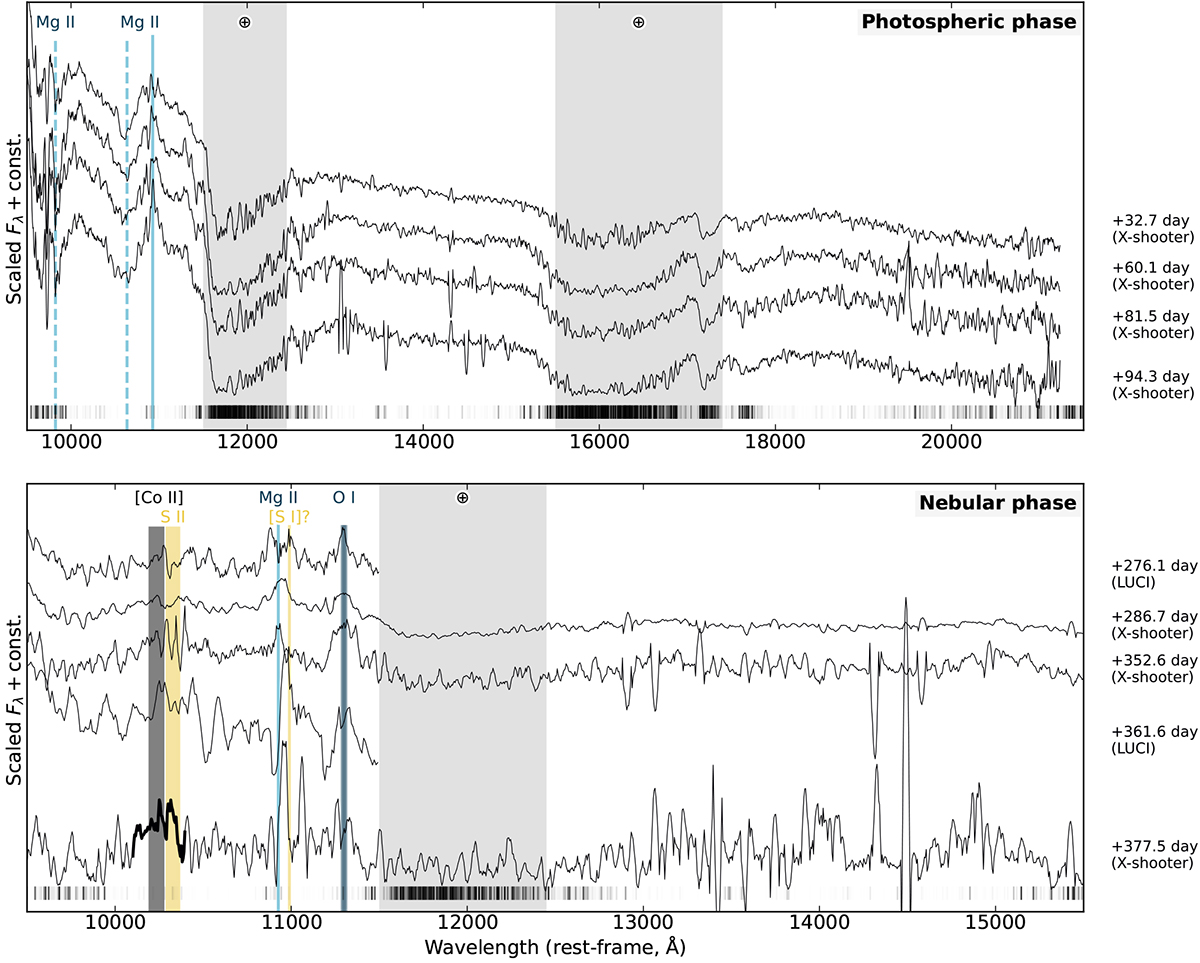
Spectroscopic sequence from 9500 to 21 500 Å. The spectral sequence covers the evolution of the photospheric (top) and nebular (bottom) phases. The NIR spectra at > 1 μm show only a few features in contrast to the optical spectra (Fig. 6). The most prominent features are labelled. All spectra were rebinned to 5 Å and smoothed with a Savitzky–Golay filter, except the spectrum at tmax+361.6 days that was rebinned to 10 Å. The grey scale at the bottom of each panel displays the strength of telluric features (white = transparent, black = opaque). In addition, regions of strong atmospheric absorption are grey-shaded.
Current usage metrics show cumulative count of Article Views (full-text article views including HTML views, PDF and ePub downloads, according to the available data) and Abstracts Views on Vision4Press platform.
Data correspond to usage on the plateform after 2015. The current usage metrics is available 48-96 hours after online publication and is updated daily on week days.
Initial download of the metrics may take a while.