Fig. 7.
Download original image
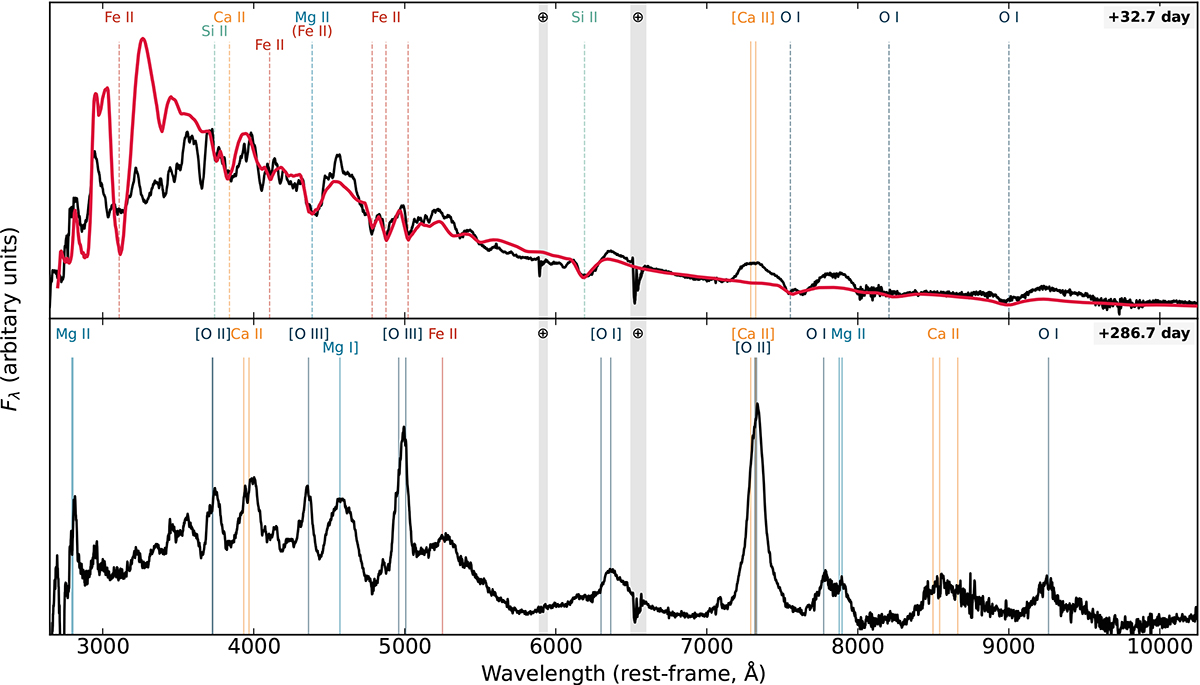
Line identification of the photospheric-phase spectrum (top) and nebular-phase spectrum (bottom). Top: The photospheric phase spectrum was fitted with the parameterised spectral synthesis code SYNOW (red curve). Most of the spectral features can be attributed to O I, Mg II, Si II, Ca II, and Fe II as seen in other SLSNe during their cool photospheric phase (Gal-Yam 2019a). In addition to the absorption lines in the SN ejecta, the photospheric phase spectrum shows conspicuous [Ca II] λλ 7291,7324, a feature that gets dominated by [O II] λλ 7320,7330 at about tmax+30 days. Bottom: The spectrum of the nebular phase consists of a blue pseudo-continuum and a series of allowed and forbidden emission lines from singly and doubly ionised oxygen, calcium, magnesium and iron. Remarkable is the presence of [O II] and [O III] in emission (as early as tmax+30 days), indicating ionising radiation from shock interactions (Sect. 5.1). SN absorption lines are indicated by dashed lines, and the locations mark the absorption trough minima (blueshifted by 8500 km s−1 from their rest wavelengths). SN emission lines are indicated by solid lines; their line centres are at the velocity coordinate v = 0. Regions of strong atmospheric absorption are grey-shaded.
Current usage metrics show cumulative count of Article Views (full-text article views including HTML views, PDF and ePub downloads, according to the available data) and Abstracts Views on Vision4Press platform.
Data correspond to usage on the plateform after 2015. The current usage metrics is available 48-96 hours after online publication and is updated daily on week days.
Initial download of the metrics may take a while.