Fig. 6.
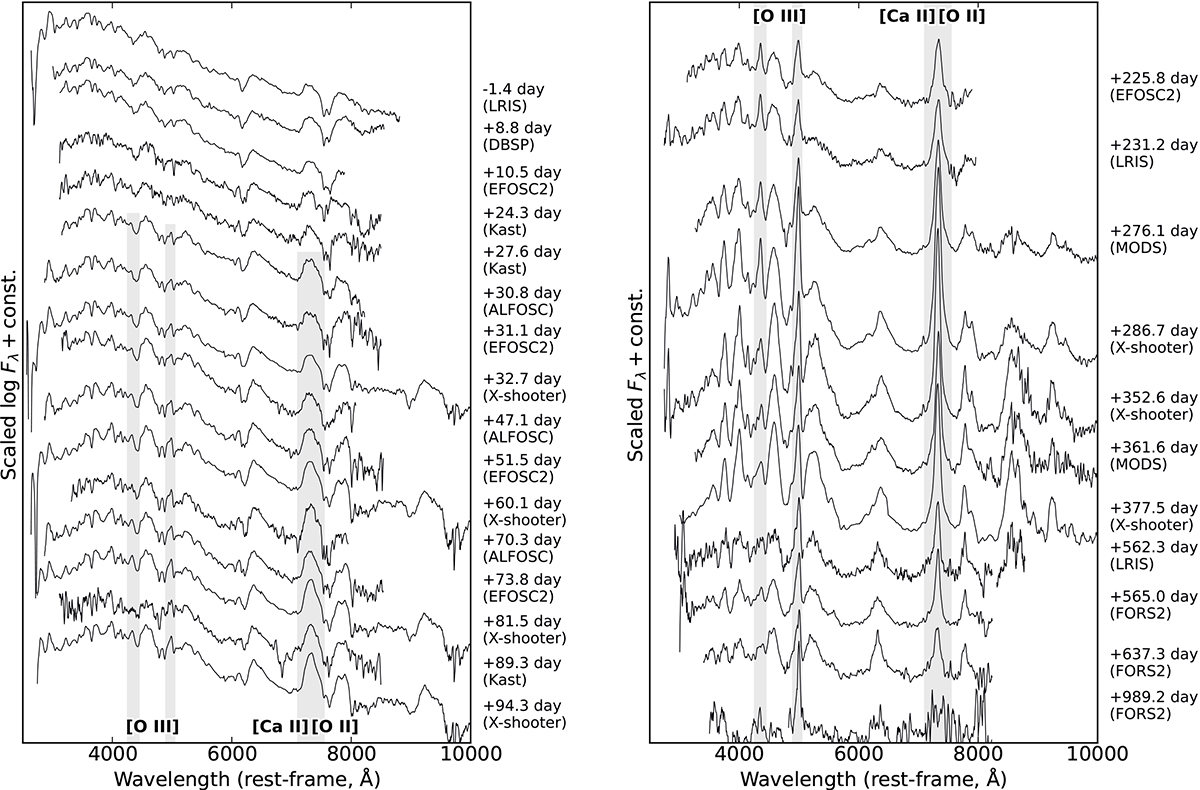
Download original image
Spectroscopic sequence from 2500 Å to 10 000 Å and from the time of maximum to tmax+1000 days (rebinned to 5 Å and smoothed with a Savitzky–Golay filter). Spectra up to tmax+100 days (left panel) are characterised by a blackbody continuum with superimposed absorption lines from the SN ejecta, expanding with a velocity of ∼8500 km s−1. Between tmax+100 and tmax+225 days (while SN 2018ibb was behind the sun), the spectroscopic behaviour of SN 2018ibb evolved drastically. The late-time spectra (right panel) are characterised in the blue (< 5000 Å) by a pseudo-continuum and emission lines produced by the interaction of the SN ejecta with circumstellar material and in the red (> 5000 Å) by nebular emission lines from the 56Ni-heated SN core. The regions with the fastest evolution are highlighted by the grey-shaded regions. Figure 7 shows the identification of the most prominent features of the photospheric and nebular phases. Regions affected by strong telluric absorption were clipped. Their locations are indicated in Fig. 7.
Current usage metrics show cumulative count of Article Views (full-text article views including HTML views, PDF and ePub downloads, according to the available data) and Abstracts Views on Vision4Press platform.
Data correspond to usage on the plateform after 2015. The current usage metrics is available 48-96 hours after online publication and is updated daily on week days.
Initial download of the metrics may take a while.