Fig. 28.
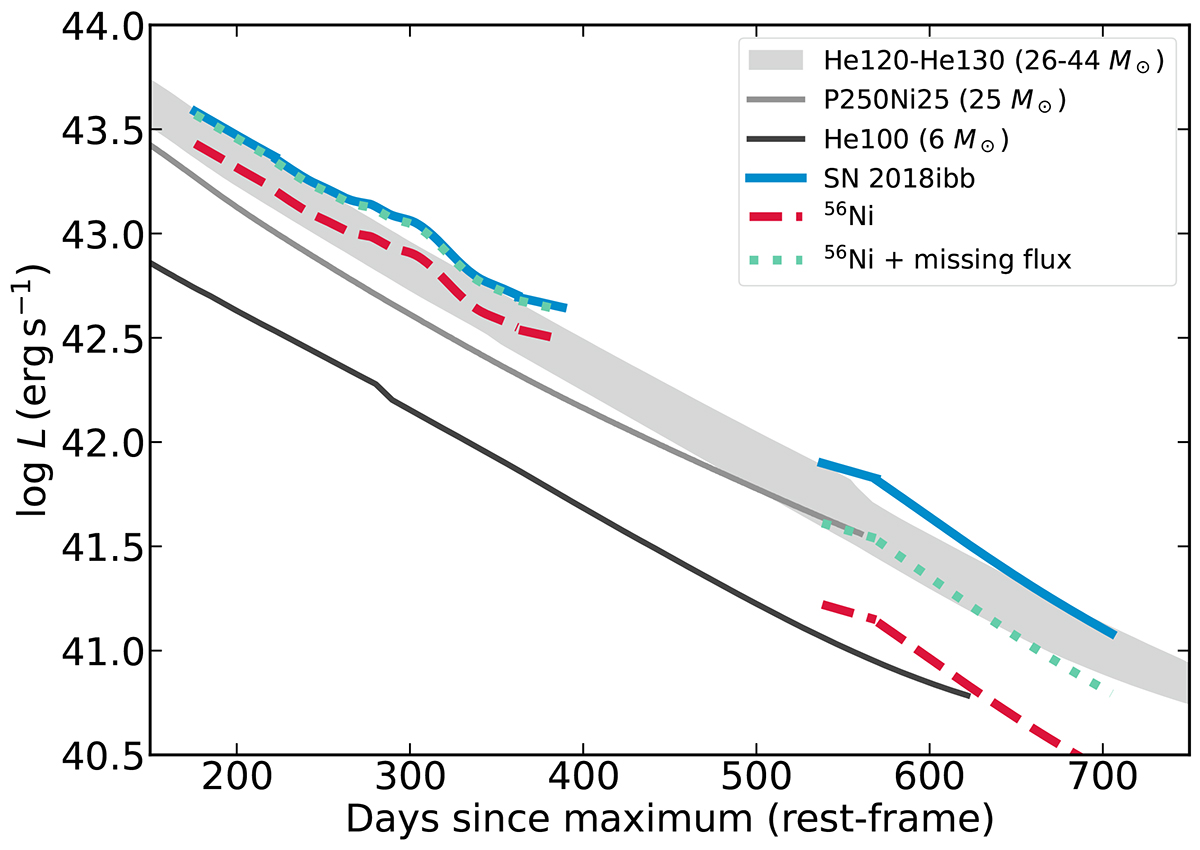
Download original image
Observed late-time bolometric light curve (solid blue lines) and the fraction of light that could be attributed to 56Ni after accounting for CSM interaction (dashed, red). The dotted green curves show the 56Ni light curve after adding the missing IR flux (up to 5 μm). The IR correction pushes the light curves back to the regime of PISN models that produce 25–44 M⊙ of 56Ni. Even in the case of a substantial contribution from CSM interaction, a total amount of 25–44 M⊙ of 56Ni appears to be essential to power SN 2018ibb.
Current usage metrics show cumulative count of Article Views (full-text article views including HTML views, PDF and ePub downloads, according to the available data) and Abstracts Views on Vision4Press platform.
Data correspond to usage on the plateform after 2015. The current usage metrics is available 48-96 hours after online publication and is updated daily on week days.
Initial download of the metrics may take a while.