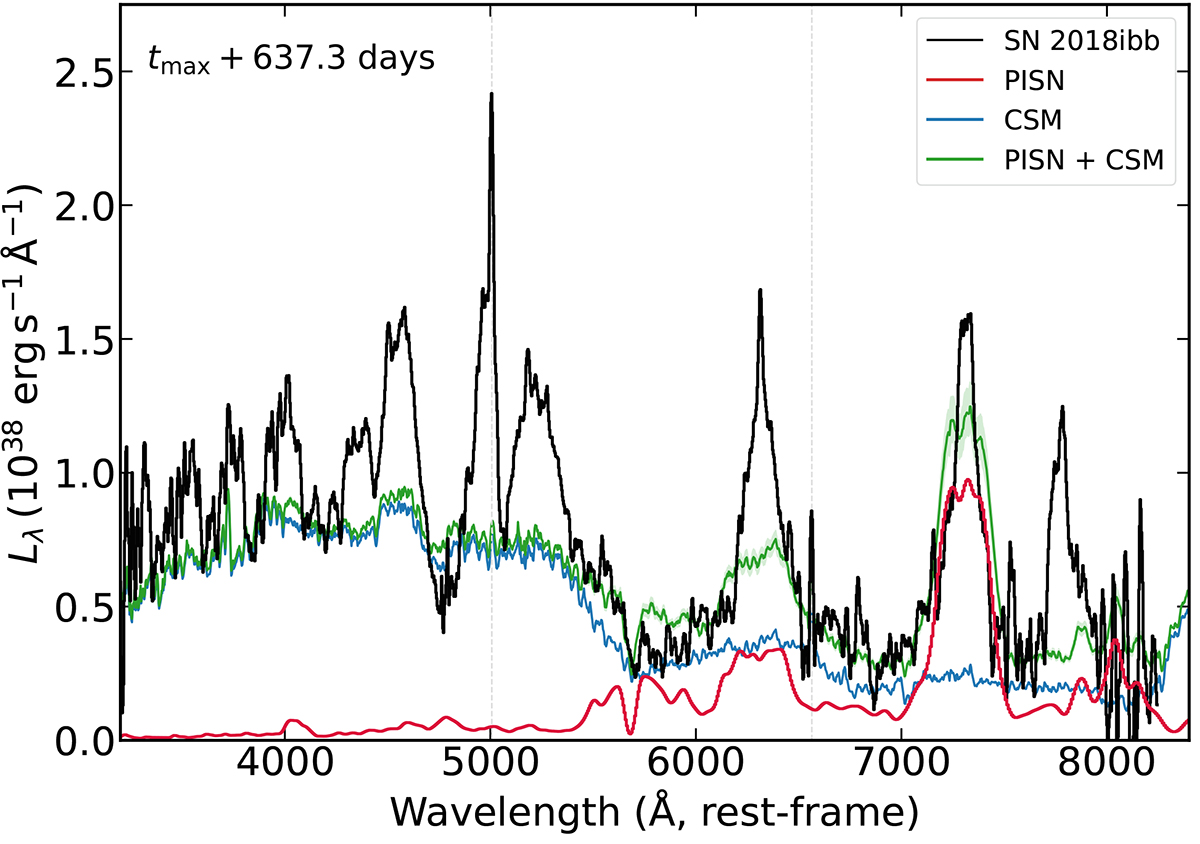
Fig. 27.
Download original image
Nebular spectrum of SN 2018ibb (black) at tmax+637.3 days and its decomposition into a CSM interaction (blue) and PISN component (red). This decomposition reveals that the shape of the spectrum in the blue is similar to the pseudo-continuum seen in interaction-powered SNe (Type Ia-CSM, Ibn, Icn and IIn). The emission lines in the blue arise either from CSM interaction or from material in the CSM shell excited by the SN light. The dotted vertical lines indicate the location of strong galaxy emission lines.
Current usage metrics show cumulative count of Article Views (full-text article views including HTML views, PDF and ePub downloads, according to the available data) and Abstracts Views on Vision4Press platform.
Data correspond to usage on the plateform after 2015. The current usage metrics is available 48-96 hours after online publication and is updated daily on week days.
Initial download of the metrics may take a while.