Fig. 26.
Download original image
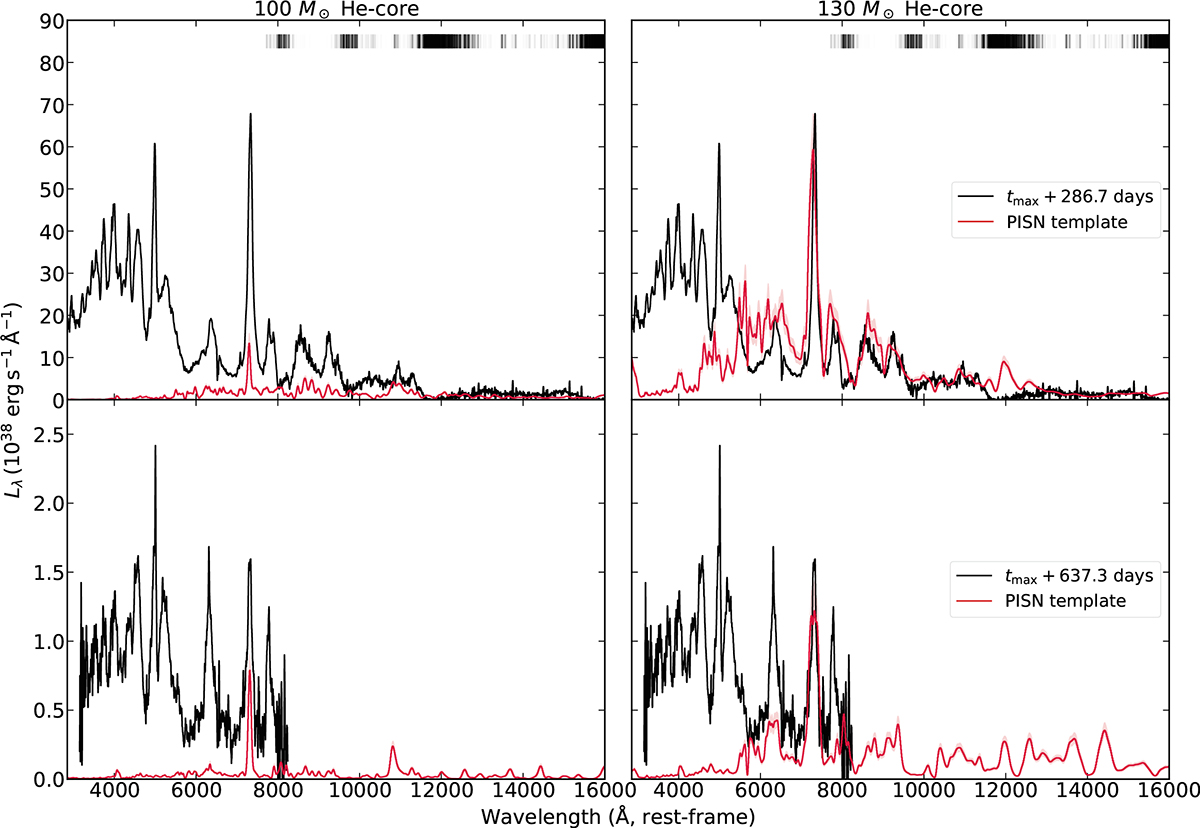
Late-time spectra of SN 2018ibb at 287 and 637 days after its maximum. Overlaid are the computed PISN spectra from Jerkstrand et al. (2016) scaled to these epochs. The shaded region indicates the uncertainty of the explosion time. The He130 model provides an adequate description of the emission redwards of 6000 Å at tmax+286.7 days, but a worse match for the second epoch. The observed spectra show a considerable excess at shorter wavelengths that is not expected from the model spectra. We argue that the blue excess is due to the interaction of the SN ejecta with circumstellar material, which is not included in existing PISN models. The He100 model matches the observation of neither epoch. The vertical bars at the top of each panel indicate the location of telluric features.
Current usage metrics show cumulative count of Article Views (full-text article views including HTML views, PDF and ePub downloads, according to the available data) and Abstracts Views on Vision4Press platform.
Data correspond to usage on the plateform after 2015. The current usage metrics is available 48-96 hours after online publication and is updated daily on week days.
Initial download of the metrics may take a while.