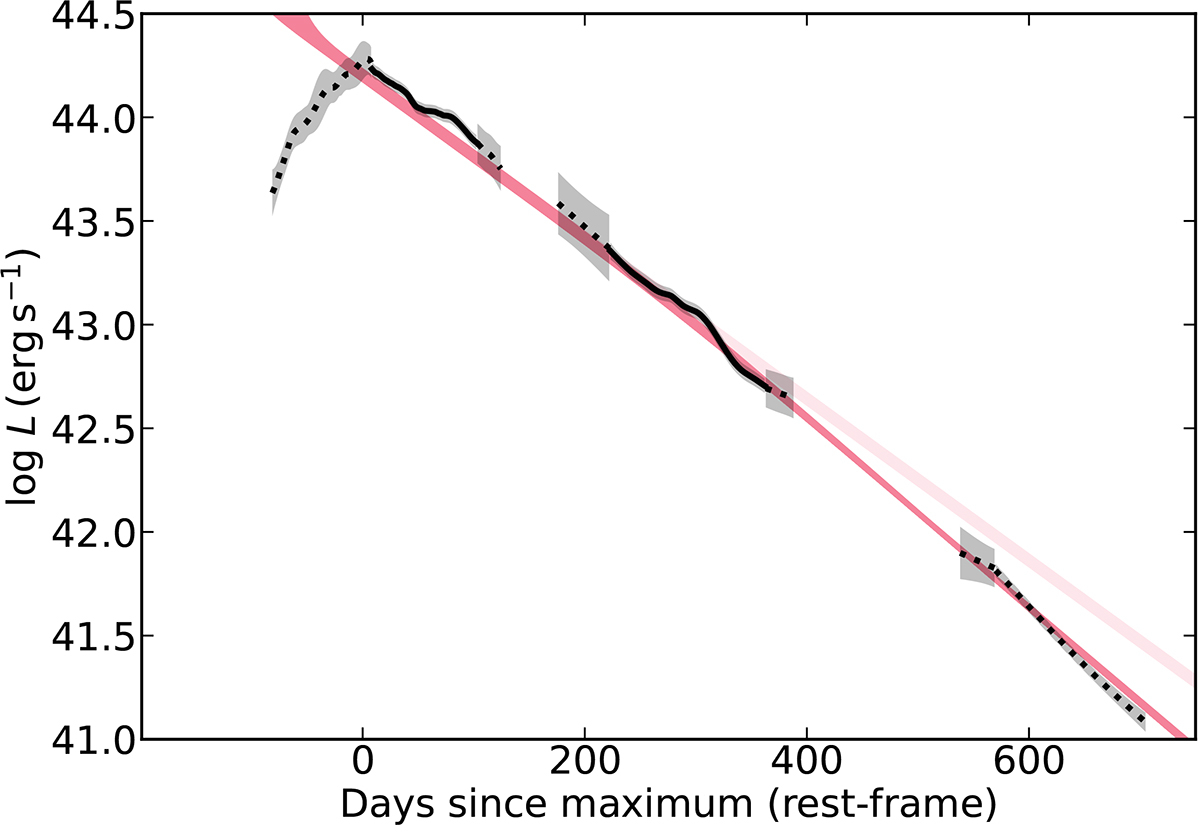
Fig. 23.
Download original image
The bolometric light curve of SN 2018ibb from 1800 to 14 300 Å (rest-frame) and light-curve fits to the fading light curve using the Katz et al. (2013) method. The entire fading light curve from up to 706 days after peak is fully consistent by being powered 24–35 M⊙ of 56Ni (dark red), suggesting that SN 2018ibb could be a pair-instability supernova. At about 300 days after peak (i.e. ≳400 days after the explosion), the γ-ray trapping decreases with time. The loss of trapping is indicated by the difference between the light-red (100% trapping) and dark-red (< 100% trapping) curves.
Current usage metrics show cumulative count of Article Views (full-text article views including HTML views, PDF and ePub downloads, according to the available data) and Abstracts Views on Vision4Press platform.
Data correspond to usage on the plateform after 2015. The current usage metrics is available 48-96 hours after online publication and is updated daily on week days.
Initial download of the metrics may take a while.