Fig. 13.
Download original image
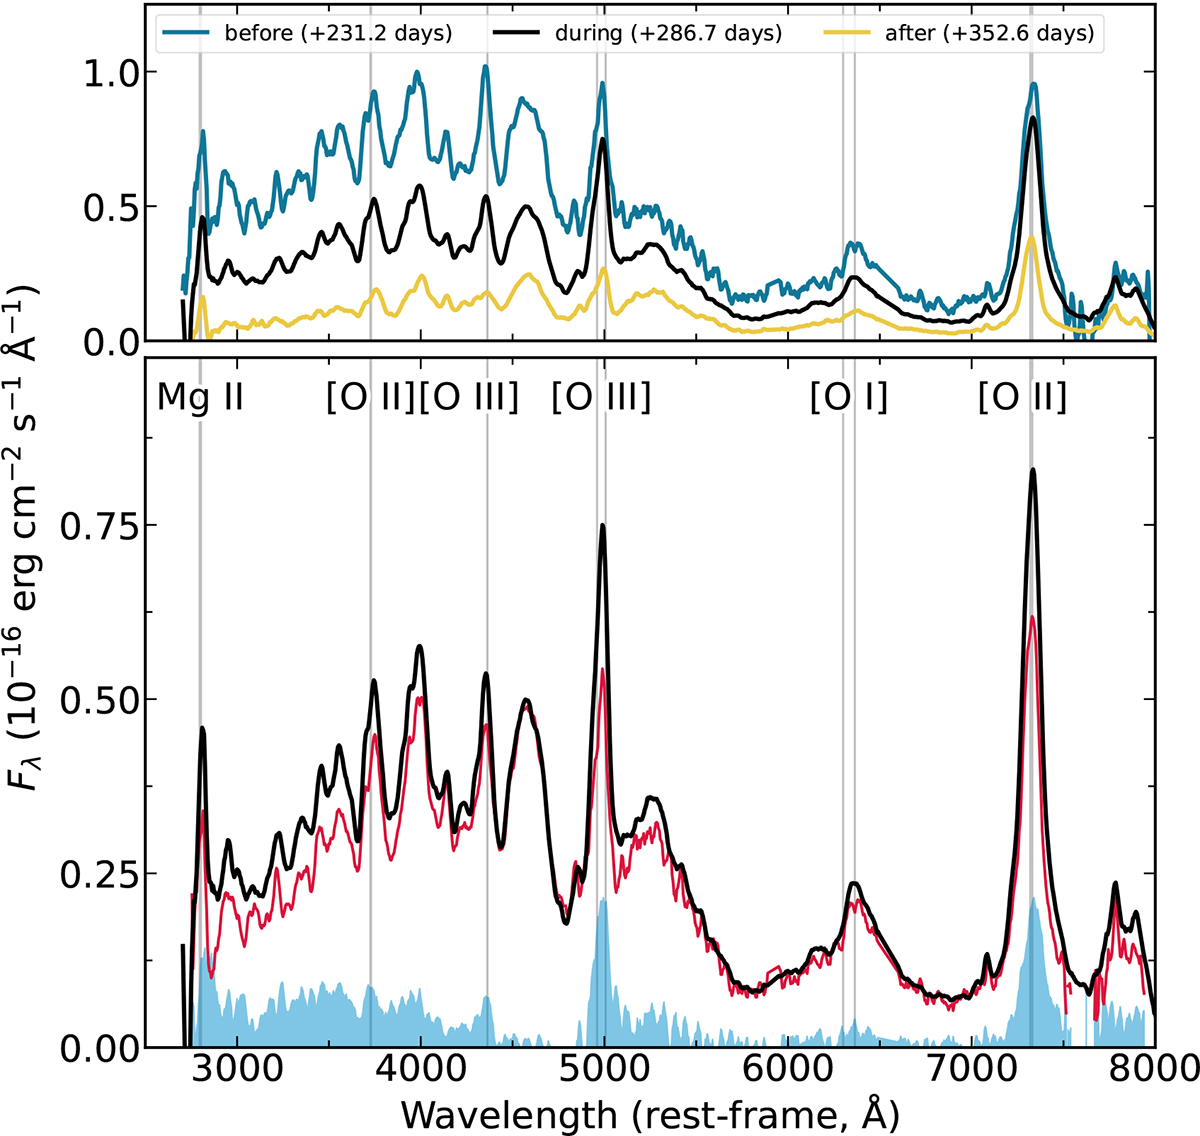
Impact of the light curve bump between tmax+240 and tmax+340 days on the SN spectrum at tmax+286.7 days. Top: The spectra before, during and after the light curve bump. Bottom: The observed spectrum at tmax+286.7 days (≈13 days before the peak of the bump) is shown in black. We estimate the “bump-free” spectrum of SN 2018ibb at tmax+286.7 days (red) based on the spectra obtained before and after the bump. The difference between the observed (black) and interpolated (red) spectra at tmax+286.7 days is shown in blue. It reveals a series of emission lines that can be attributed to [O II] and [O III]. An excess bluewards of 5000 Å is also visible, while no apparent residual can be seen at the location of [O I].
Current usage metrics show cumulative count of Article Views (full-text article views including HTML views, PDF and ePub downloads, according to the available data) and Abstracts Views on Vision4Press platform.
Data correspond to usage on the plateform after 2015. The current usage metrics is available 48-96 hours after online publication and is updated daily on week days.
Initial download of the metrics may take a while.