Open Access
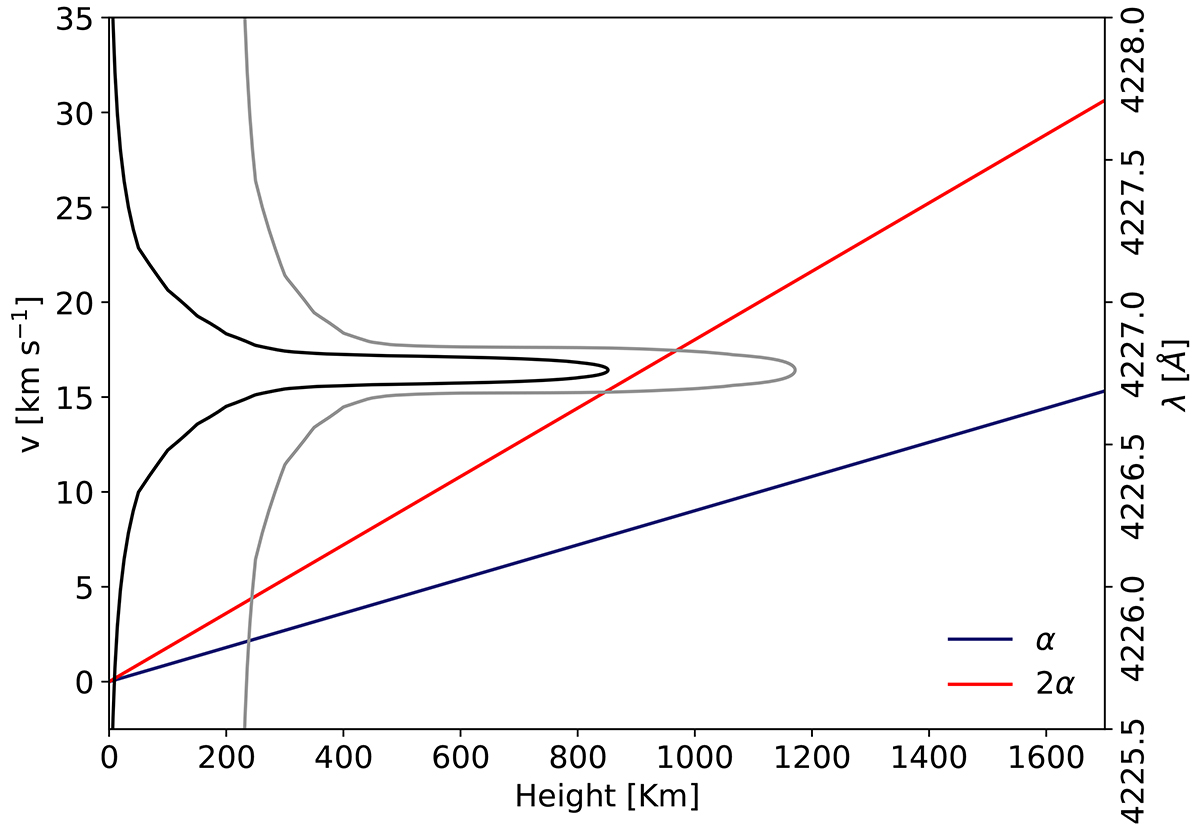
Fig. 2.
Download original image
Bulk velocity profiles with constant vertical gradients α (blue line) and 2α (red line), with α = 0.009 s−1. The black and grey curves display the height at which the optical depth, as a function of frequency, is unity, for μ = 0.96 and μ = 0.03, respectively.
Current usage metrics show cumulative count of Article Views (full-text article views including HTML views, PDF and ePub downloads, according to the available data) and Abstracts Views on Vision4Press platform.
Data correspond to usage on the plateform after 2015. The current usage metrics is available 48-96 hours after online publication and is updated daily on week days.
Initial download of the metrics may take a while.