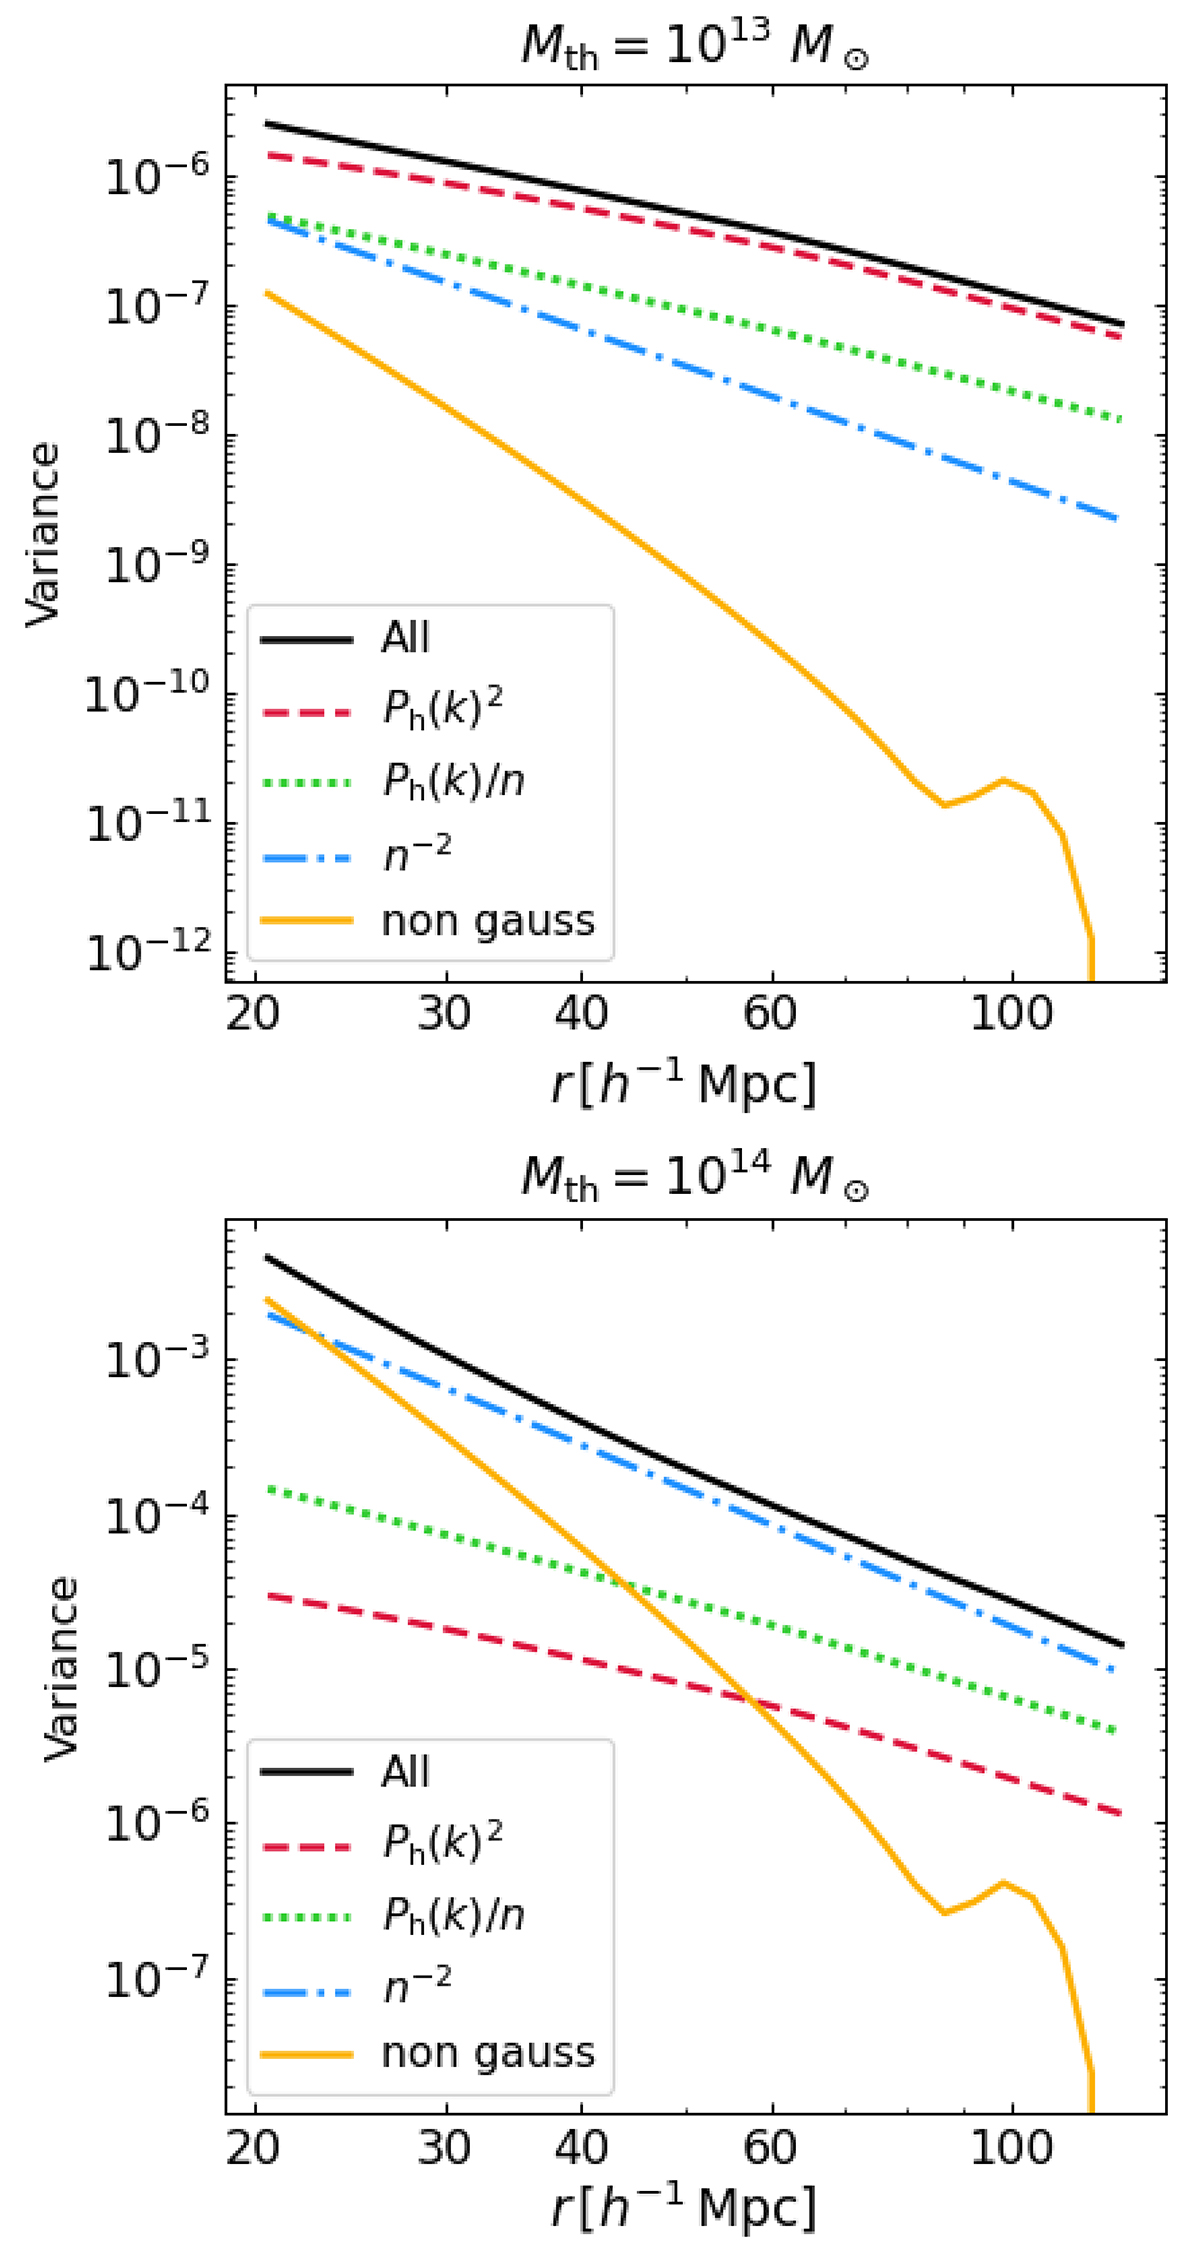
Fig. F.1.
Download original image
Diagonal contributions to the covariance matrix composing the model of Eq. (12). The red, green, and blue lines represent the three terms of the Gaussian covariance, and the yellow line is the non-Gaussian term. The comparison is shown for two different mass thresholds: a low-mass threshold Mth = 1 × 10¹³ M⊙ in the top panel, and a high-mass threshold Mth = 1 × 10¹⁴ M⊙ in the bottom panel. The terms are obtained by evaluating the covariance model at the input cosmology in the redshift bin z = 0.8 − 1.2.
Current usage metrics show cumulative count of Article Views (full-text article views including HTML views, PDF and ePub downloads, according to the available data) and Abstracts Views on Vision4Press platform.
Data correspond to usage on the plateform after 2015. The current usage metrics is available 48-96 hours after online publication and is updated daily on week days.
Initial download of the metrics may take a while.