Open Access
Fig. B.1.
Download original image
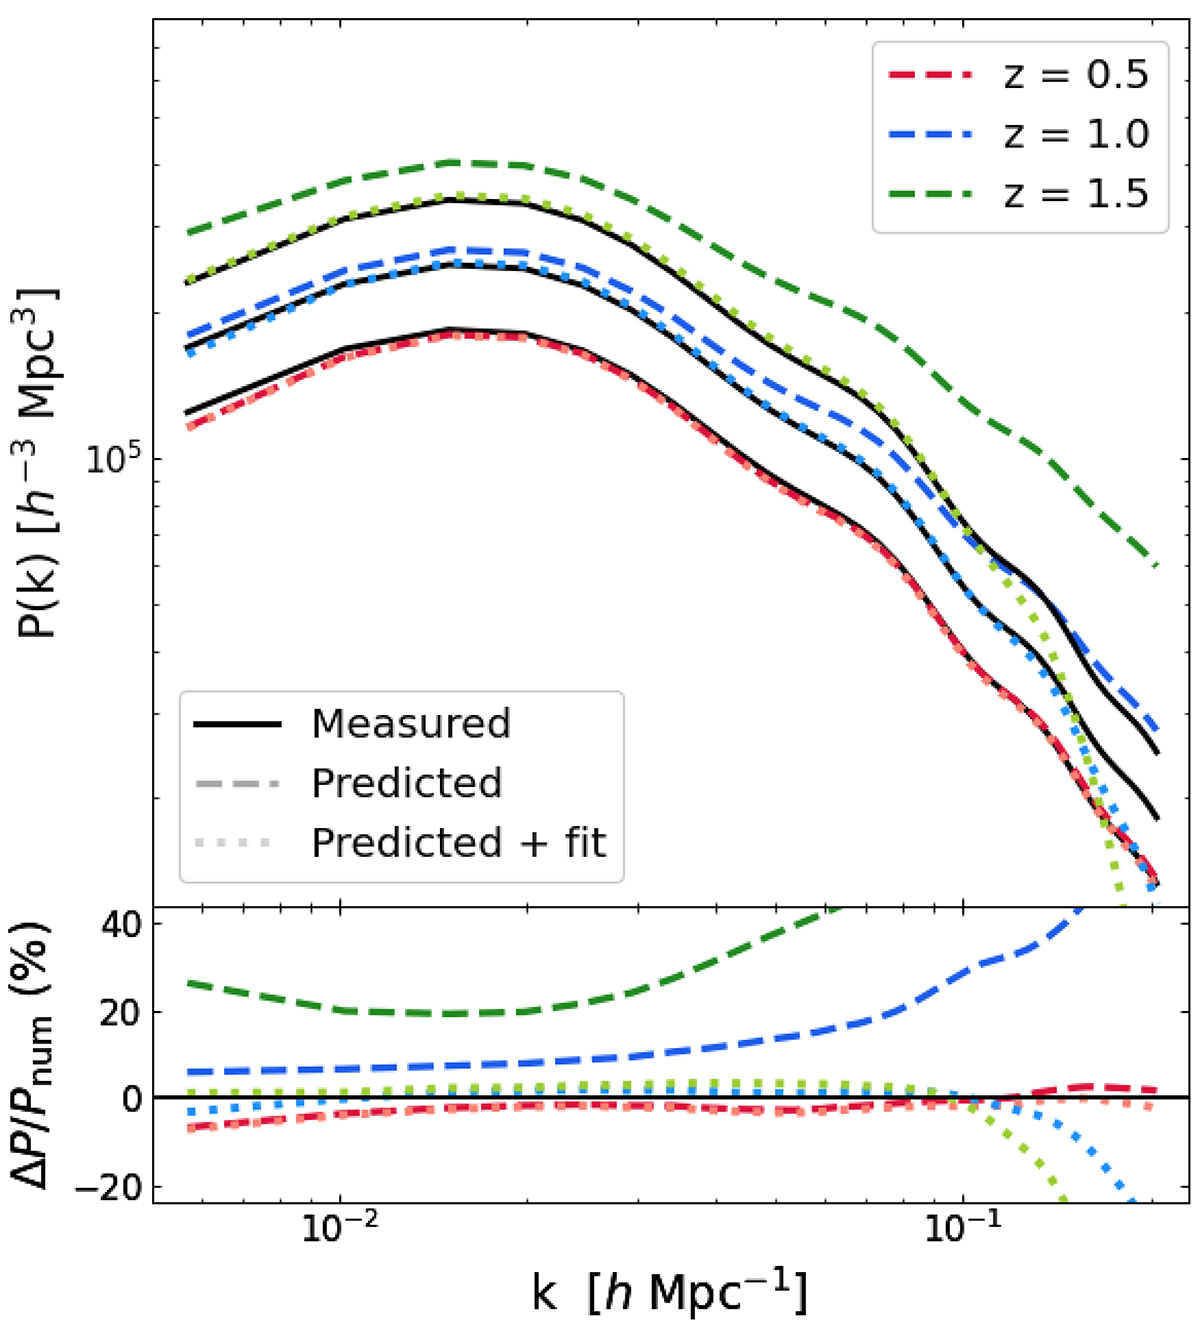
Halo power spectrum. Top panel: Measured (solid black lines), predicted (dashed darker lines), and fitted (dotted lighter lines) halo power spectrum for boxes at three different redshifts. Bottom panel: Percent residuals of the predictions with respect to the measured residuals.
Current usage metrics show cumulative count of Article Views (full-text article views including HTML views, PDF and ePub downloads, according to the available data) and Abstracts Views on Vision4Press platform.
Data correspond to usage on the plateform after 2015. The current usage metrics is available 48-96 hours after online publication and is updated daily on week days.
Initial download of the metrics may take a while.