Fig. 3

Download original image
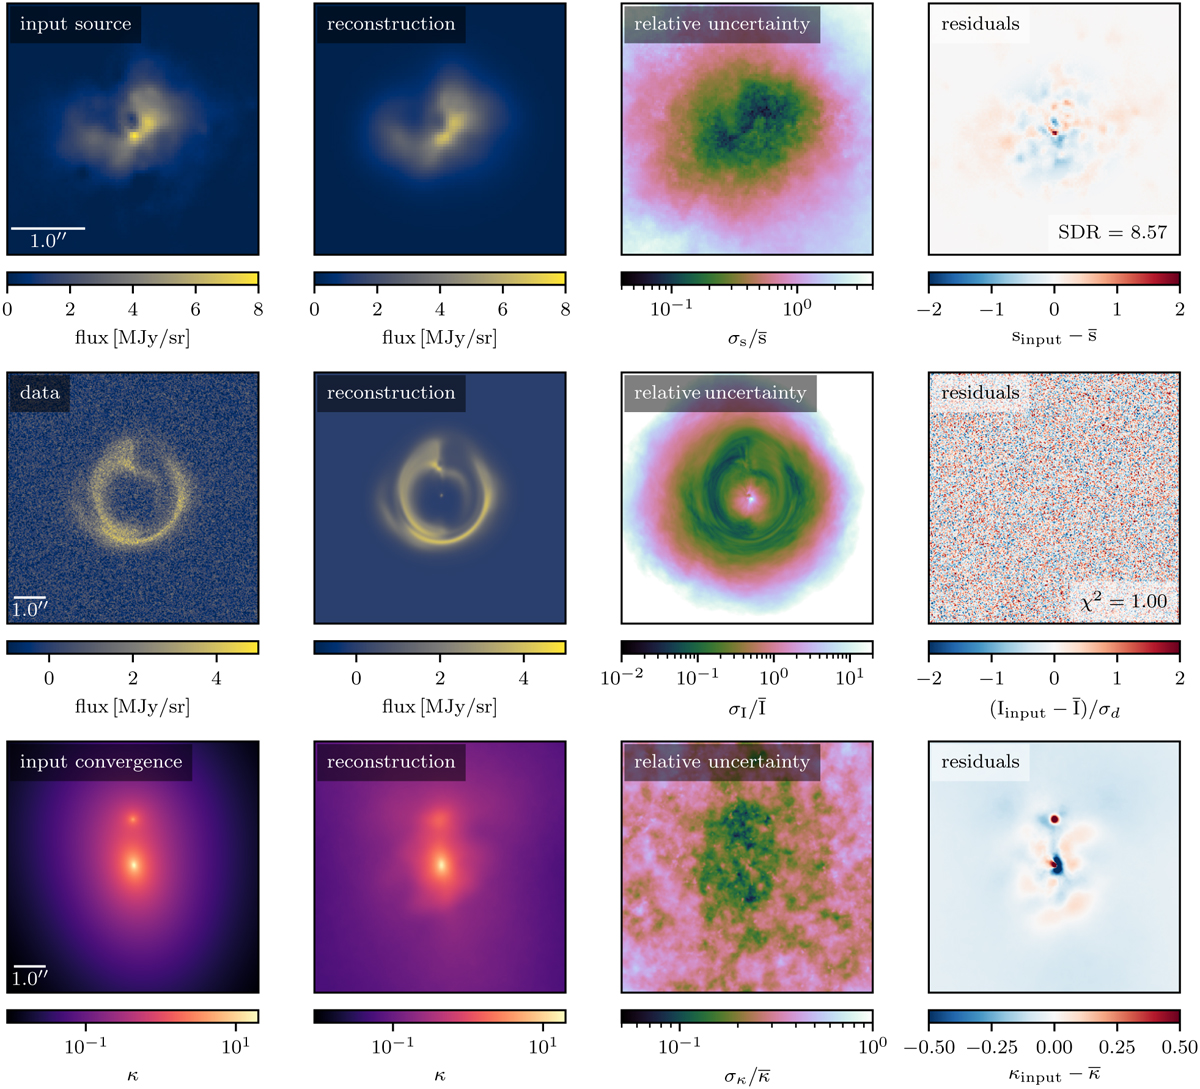
Reconstruction of simulated strong lensing observation with JWST. Top panels: input source model is depicted next to its reconstruction, which is the mean of the source flux averaged over the approximating posterior. Next, we display the relative uncertainties estimated from posterior samples. Lastly, the residuals between the input and the reconstruction are displayed (described from left to right). Middle panels: simulated JWST data, its reconstruction, relative uncertainty of the reconstruction, and normalized data residuals. Bottom panels: input convergence, its reconstruction, the relative uncertainty of the convergence reconstruction, and the residuals between the input convergence and its reconstruction.
Current usage metrics show cumulative count of Article Views (full-text article views including HTML views, PDF and ePub downloads, according to the available data) and Abstracts Views on Vision4Press platform.
Data correspond to usage on the plateform after 2015. The current usage metrics is available 48-96 hours after online publication and is updated daily on week days.
Initial download of the metrics may take a while.


