Fig. 6
Download original image
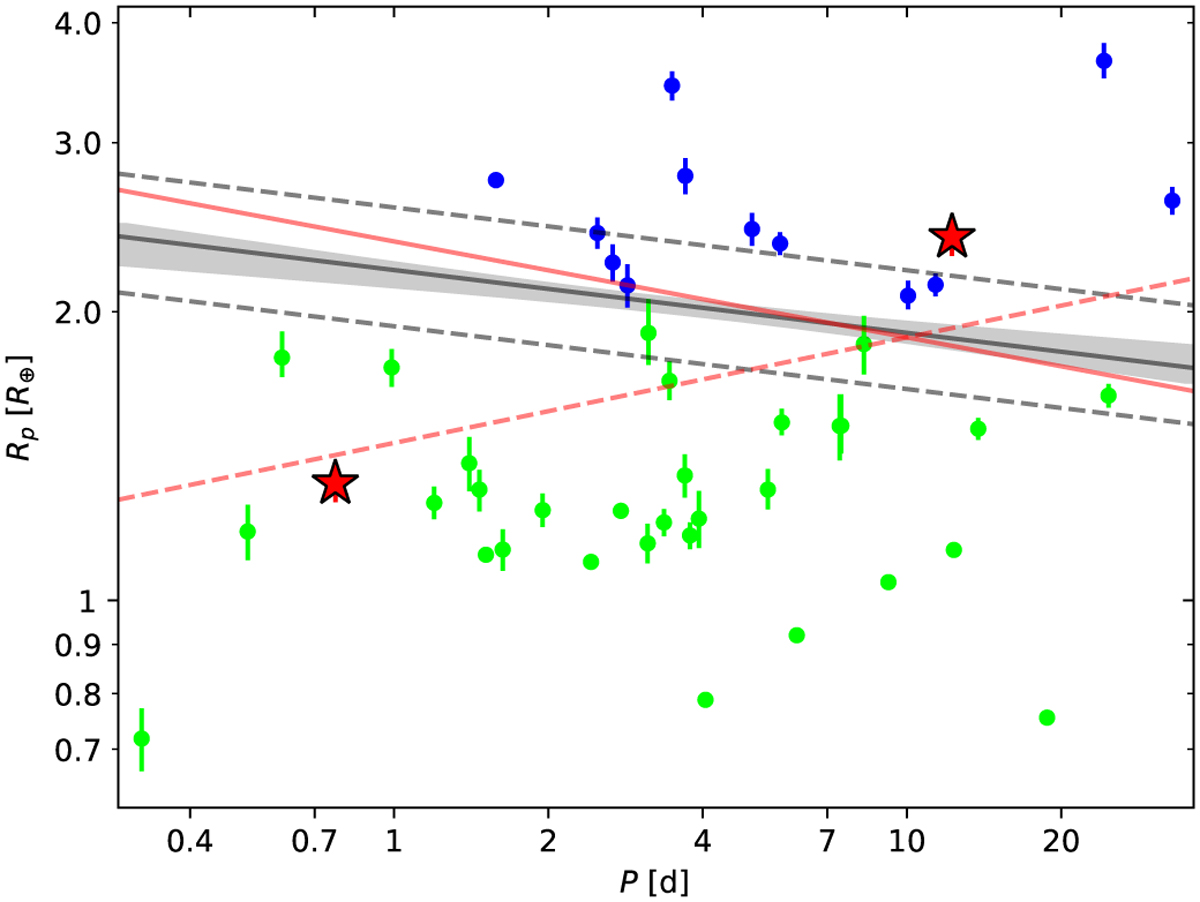
Rp vs P distribution representing the planets in our Msample. Planets classified above and below the radius valley are shown in blue and green, respectively, while the red star-shaped markers are for TOI-732 b and c. The radius valley inferred via the SVM-based method is marked by the solid grey line with the shaded region highlighting the 1 σ limits of the best-fit line. The two parallel dashed grey lines are the median boundaries passing through the supporting vectors that determine the location of the solid line. Finally, the red lines represent the theoretically expected Rp,valley boundary in case of a thermally-driven mass-loss scenario (solid line as computed from Affolter et al. 2023; negative slope) and the Rp upper limit of planets borned rocky in a gas-empty disc (dashed line as computed from Lopez & Rice 2018; positive slope).
Current usage metrics show cumulative count of Article Views (full-text article views including HTML views, PDF and ePub downloads, according to the available data) and Abstracts Views on Vision4Press platform.
Data correspond to usage on the plateform after 2015. The current usage metrics is available 48-96 hours after online publication and is updated daily on week days.
Initial download of the metrics may take a while.