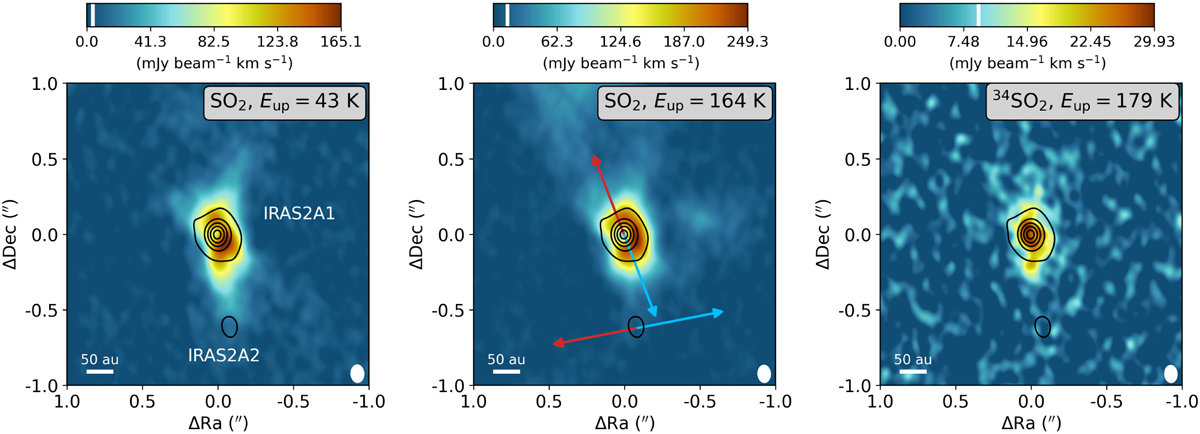
Fig. 6
Download original image
Integrated intensity maps of the SO2 82,6−71,7 (left, Eup = 43 K), SO2 164,12−163,13 (middle, Eup = 164 K), and 34SO2 174,14−173,15 (right, Eup = 178 K) transitions in color. The images are integrated over [−2,2] km s−1 with respect to the Visr of 6.7 km s−1. The white vertical bar in the colorbar on top of each image indicates the 3σ threshold. The 0.875 mm continuum is overlaid as black contours. The main continuum peak is associated with IRAS 2A1 and the secondary peak toward the south with IRAS 2A2. The directions of the two outflows originating from IRAS 2A1 and IRAS 2A2 are indicated with the colored arrows in the middle panel (Tobin et al. 2015). The size of the beam is shown in the bottom right, and in the bottom left a scale bar is displayed.
Current usage metrics show cumulative count of Article Views (full-text article views including HTML views, PDF and ePub downloads, according to the available data) and Abstracts Views on Vision4Press platform.
Data correspond to usage on the plateform after 2015. The current usage metrics is available 48-96 hours after online publication and is updated daily on week days.
Initial download of the metrics may take a while.