Fig. 4
Download original image
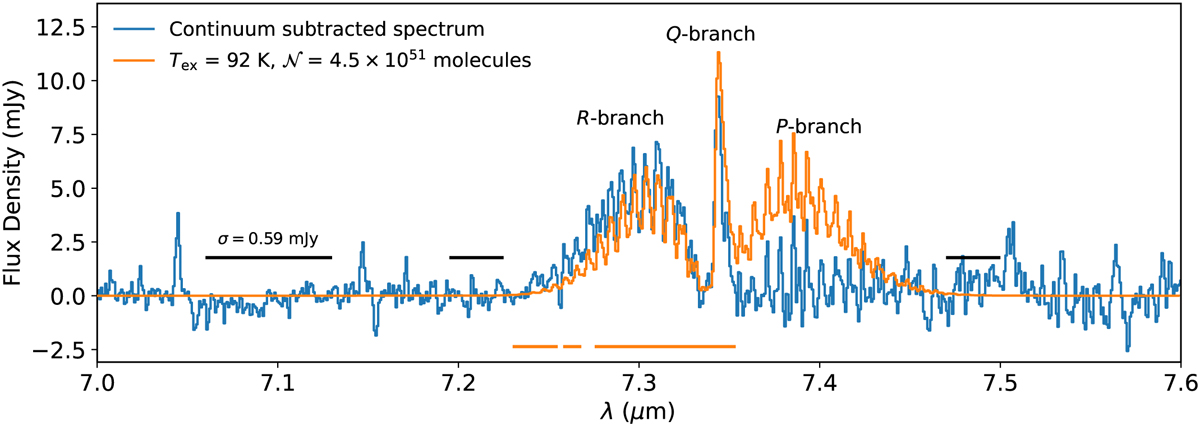
Continuum-subtracted spectrum (blue) overlaid with the best-fit SO2 model (orange). The orange bars in the bottom indicate the wavelength ranges that were included in the fit, and the black bars show the wavelength ranges over which σ is calculated. The P-branch lines around 7.4 µm appear to be overfitted since the 7.4 µm ice absorption could not be disentangled from the gas-phase emission.
Current usage metrics show cumulative count of Article Views (full-text article views including HTML views, PDF and ePub downloads, according to the available data) and Abstracts Views on Vision4Press platform.
Data correspond to usage on the plateform after 2015. The current usage metrics is available 48-96 hours after online publication and is updated daily on week days.
Initial download of the metrics may take a while.