Fig. 3
Download original image
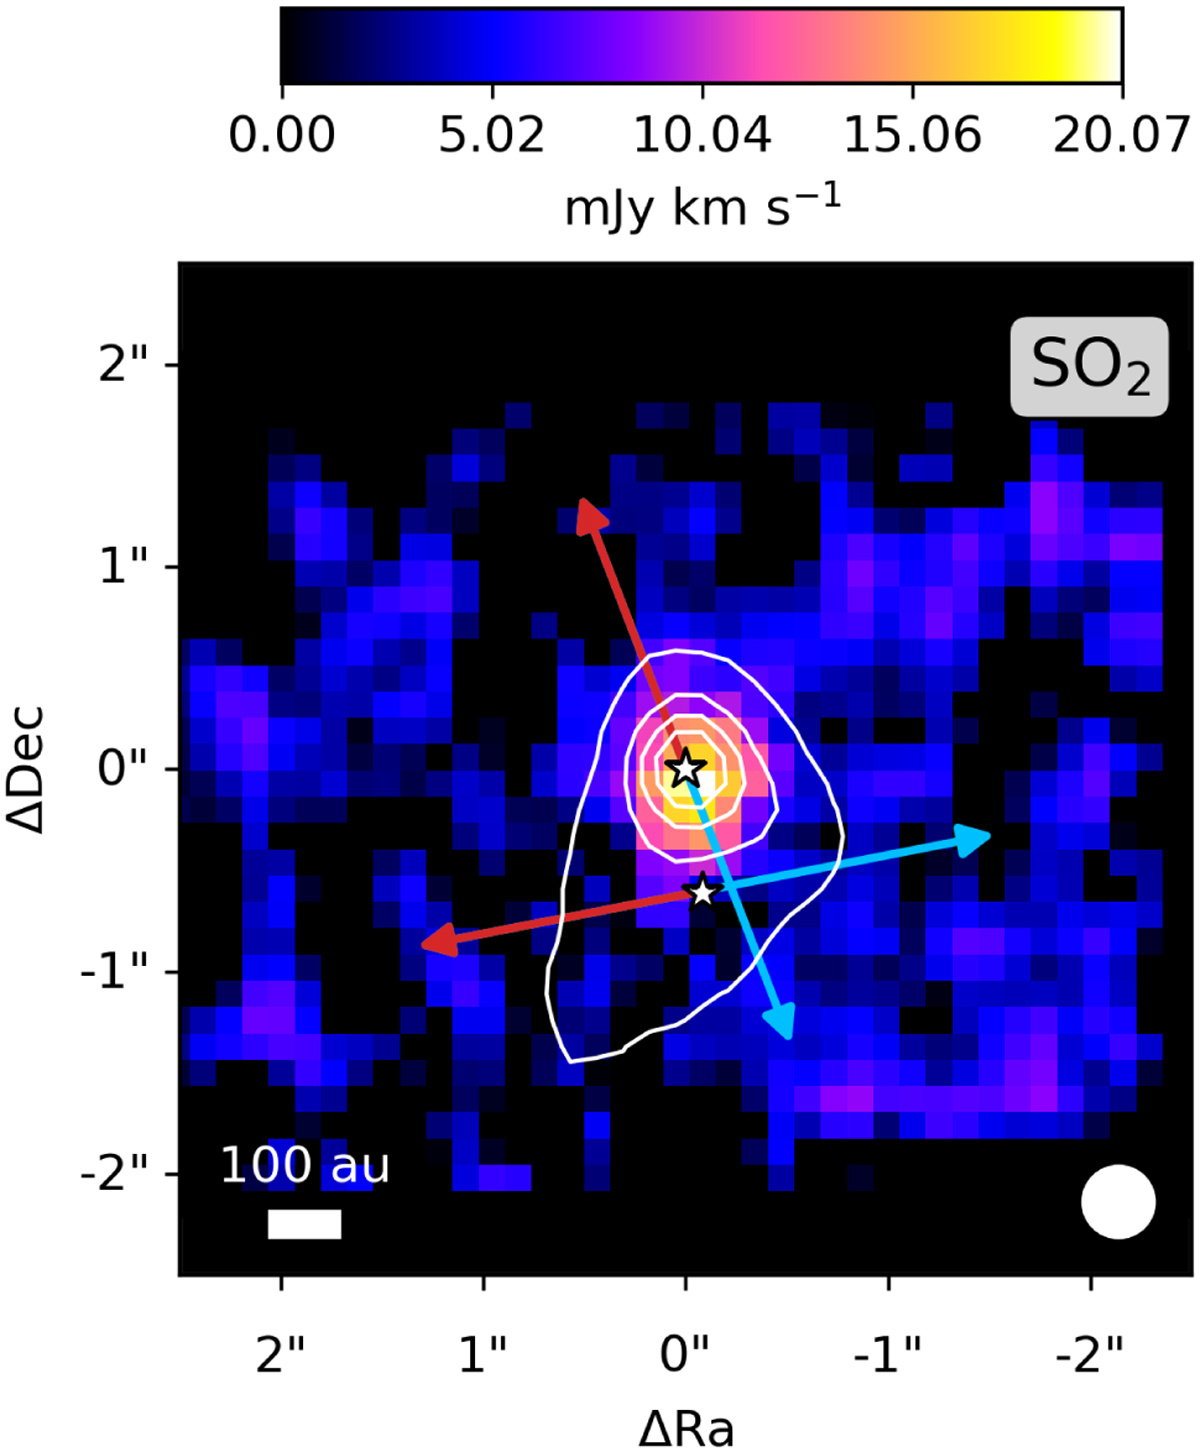
Integrated intensity map of SO2 observed with MIRI-MRS in color. The image is integrated over the Q-branch of the v3 band: [7.34,7.35] µm and shown using a sqrt stretch to enhance fainter emission. The continuum around 7.35 µm is overlaid in white contours and peaks on the primary component, IRAS 2A1, extending somewhat toward the south in the direction of the scattered light. The positions of IRAS 2A1 and IRAS 2A2 are depicted with the white stars. A white scale bar is displayed in the bottom left, and the size of the PSF is presented as the filled white circle in the bottom right. The directions of the two outflows originating from IRAS 2A1 and IRAS 2A2 are indicated with the colored arrows (Tobin et al. 2015).
Current usage metrics show cumulative count of Article Views (full-text article views including HTML views, PDF and ePub downloads, according to the available data) and Abstracts Views on Vision4Press platform.
Data correspond to usage on the plateform after 2015. The current usage metrics is available 48-96 hours after online publication and is updated daily on week days.
Initial download of the metrics may take a while.