Fig. 2
Download original image
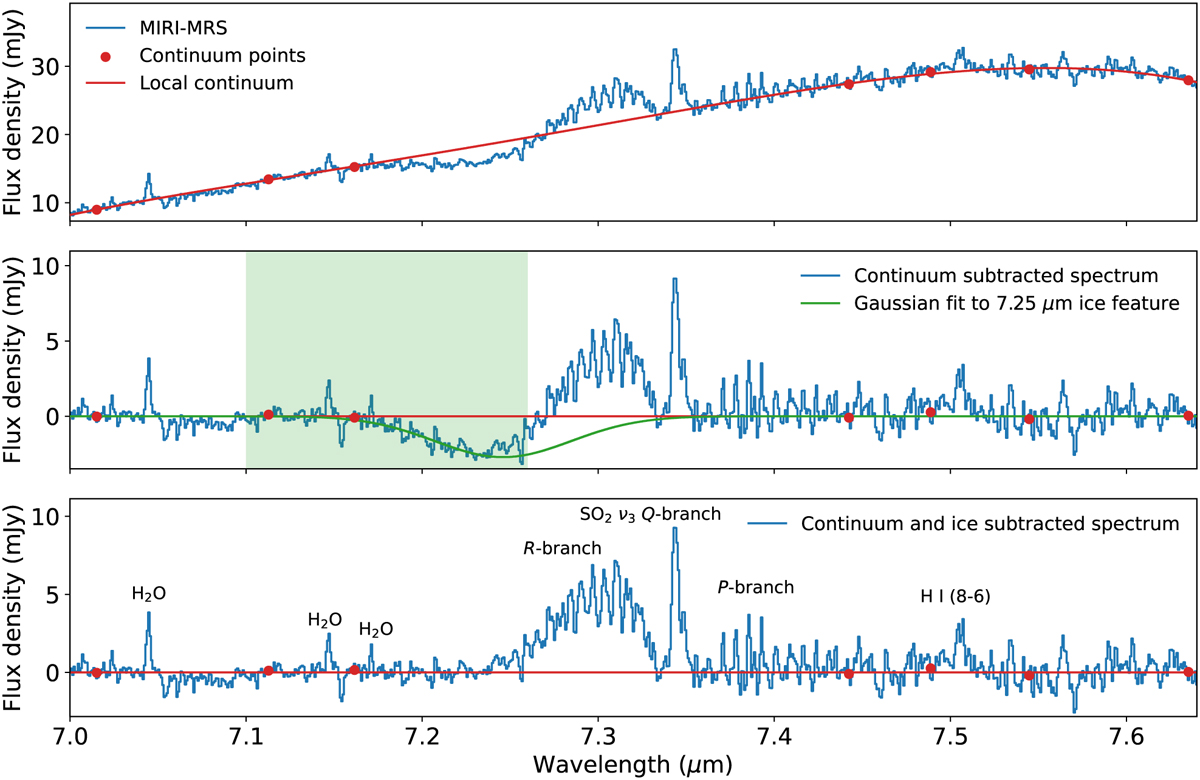
Subtracting the local continuum around the SO2 v3 band. Top: spectrum of IRAS 2A around 7.35 µm showing the gas-phase SO2 emission superimposed at various ice absorption bands. The red line shows the estimated local continuum based on a fourth-order polynomial fit through the red dots. Middle: spectrum of IRAS 2A with the local continuum subtracted. The 7.25 µm complex organics ice absorption feature is clearly present. A simple Gaussian fit to this ice absorption feature based on fitting the spectrum in the shaded region is shown in green. Bottom: final continuum- and ice-feature-subtracted spectrum.
Current usage metrics show cumulative count of Article Views (full-text article views including HTML views, PDF and ePub downloads, according to the available data) and Abstracts Views on Vision4Press platform.
Data correspond to usage on the plateform after 2015. The current usage metrics is available 48-96 hours after online publication and is updated daily on week days.
Initial download of the metrics may take a while.