Fig. D.1
Download original image
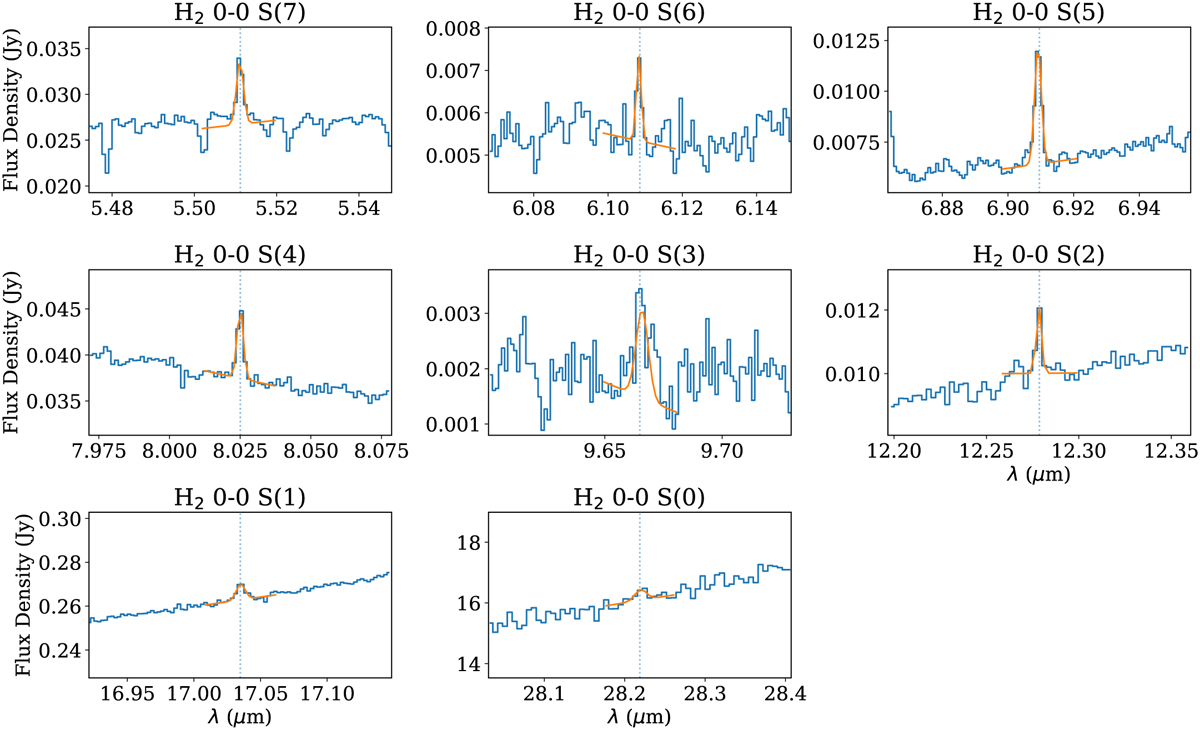
Observed MIRI-MRS spectrum (blue) centered around H2 v = 0 pure rotational lines from the S(7) line in the top-left panel to the S(0) line in the bottom-middle panel. The best-fit Gaussian model is presented in orange in each panel. All presented lines are considered detected except for the S(0) line since the flux is similar to that of several strong residual fringes located in the vicinity of the S(0) line.
Current usage metrics show cumulative count of Article Views (full-text article views including HTML views, PDF and ePub downloads, according to the available data) and Abstracts Views on Vision4Press platform.
Data correspond to usage on the plateform after 2015. The current usage metrics is available 48-96 hours after online publication and is updated daily on week days.
Initial download of the metrics may take a while.