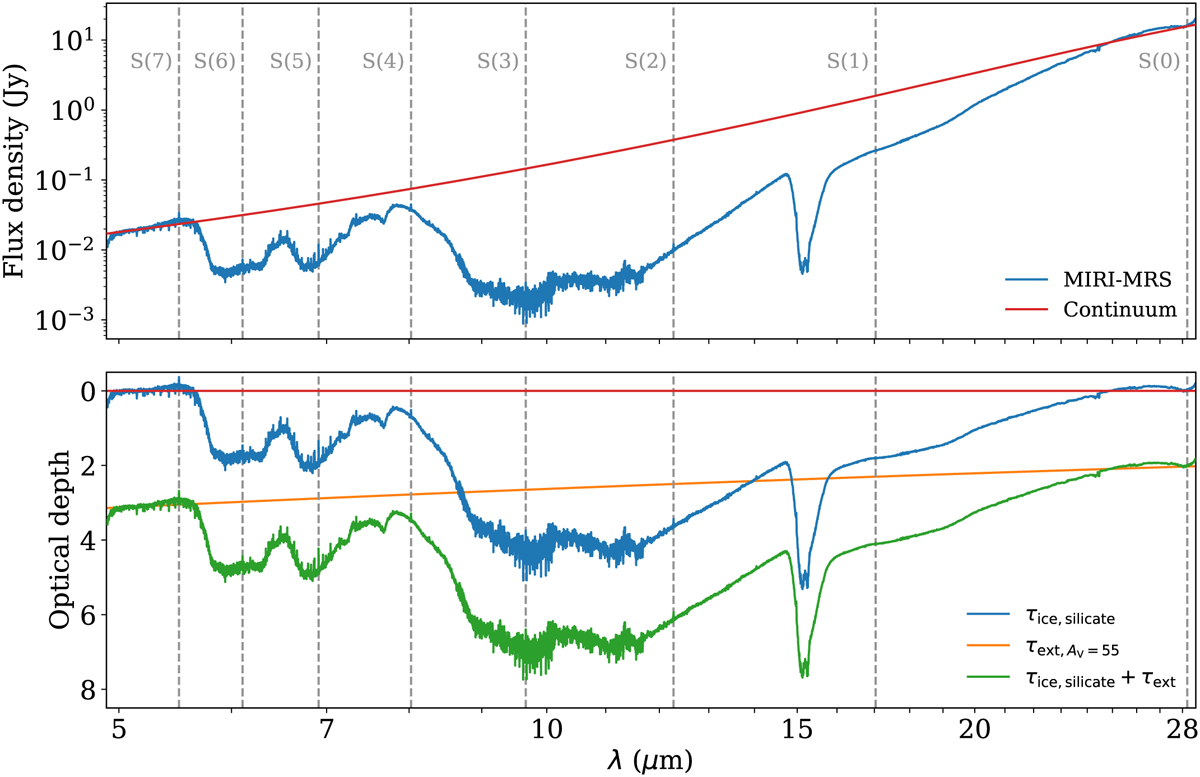
Fig. C.1
Download original image
Determining the extinction due to ice and silicate absorption. Top: Observed MIRI-MRS spectrum of IRAS2A (blue) with the global continuum estimate (red) overplotted. The continuum is based on a third-order polynomial fit to emission- and absorption-free wavelength ranges. The positions of the H2 v = 0 rotational transitions are indicated with the vertical dashed gray lines. Bottom: Differential extinction in units of optical depth (blue) of the absorption features as a function of wavelength derived from the global continuum estimate (Eq. (C.2)). Overplotted is the absolute extinction (orange) computed using Eq. (C.3); see the main text for more details. The total extinction (green) is computed from the sum of the two (Eq. (C.1)).
Current usage metrics show cumulative count of Article Views (full-text article views including HTML views, PDF and ePub downloads, according to the available data) and Abstracts Views on Vision4Press platform.
Data correspond to usage on the plateform after 2015. The current usage metrics is available 48-96 hours after online publication and is updated daily on week days.
Initial download of the metrics may take a while.