Fig. B.3
Download original image
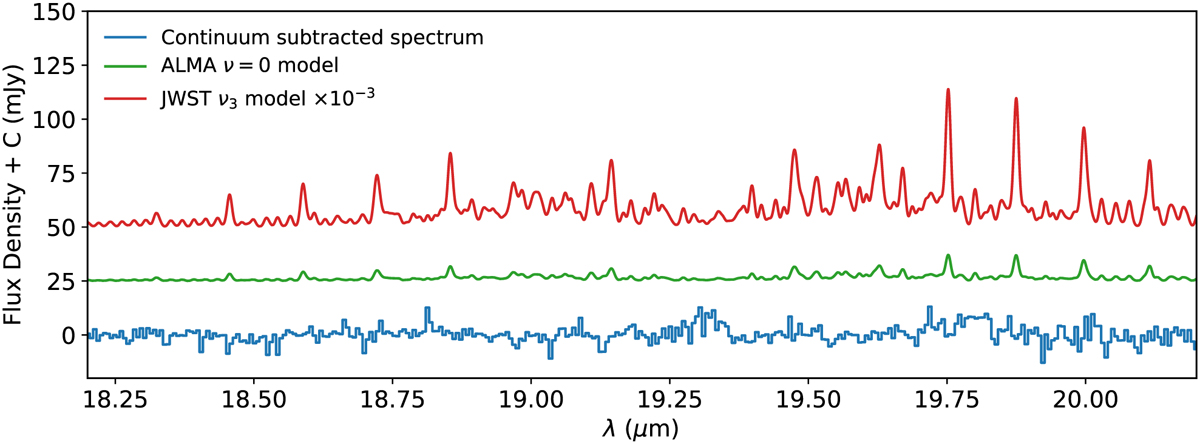
JWST/MIRI-MRS continuum-subtracted spectrum (blue) centered on the v2 band of SO2 around 19 µm. No clear emission or absorption features of SO2 are detected. Overlaid are LTE slab models obtained using the best-fit parameters derived from the v3 band around 7.35 µm (red) and the pure rotational lines in the ALMA data (green). The MIRI slab model is scaled down by a factor of 10−3 for clarity. Both models are offset with respect to the data and are corrected for an extinction of AV = 55 mag (Rocha et al. 2024) using a modified version of the McClure (2009) extinction law (see Appendix C).
Current usage metrics show cumulative count of Article Views (full-text article views including HTML views, PDF and ePub downloads, according to the available data) and Abstracts Views on Vision4Press platform.
Data correspond to usage on the plateform after 2015. The current usage metrics is available 48-96 hours after online publication and is updated daily on week days.
Initial download of the metrics may take a while.