Fig. B.2
Download original image
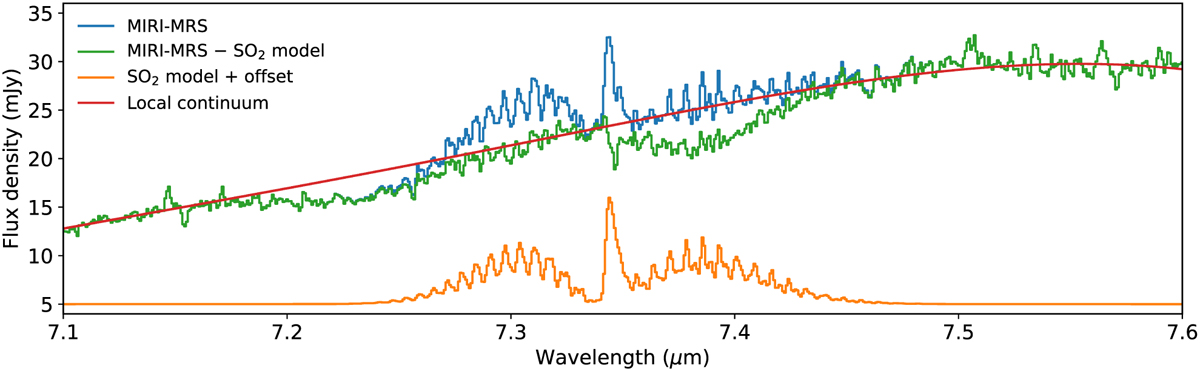
Spectrum of IRAS2A in blue centered around the v3 band of SO2 as observed by JWST/MIRI-MRS. The local continuum fit is shown in red and the best-fit LTE slab model in orange at a +5 mJy offset. In green, the SO2-subtracted data are presented, revealing the 7.4 µm ice absorption feature that was hidden by the P-branch of the SO2 v3 band. The Q-branch is slightly overfitted, resulting in a subtraction residual. The ice absorption bands are further analyzed by Rocha et al. (2024).
Current usage metrics show cumulative count of Article Views (full-text article views including HTML views, PDF and ePub downloads, according to the available data) and Abstracts Views on Vision4Press platform.
Data correspond to usage on the plateform after 2015. The current usage metrics is available 48-96 hours after online publication and is updated daily on week days.
Initial download of the metrics may take a while.