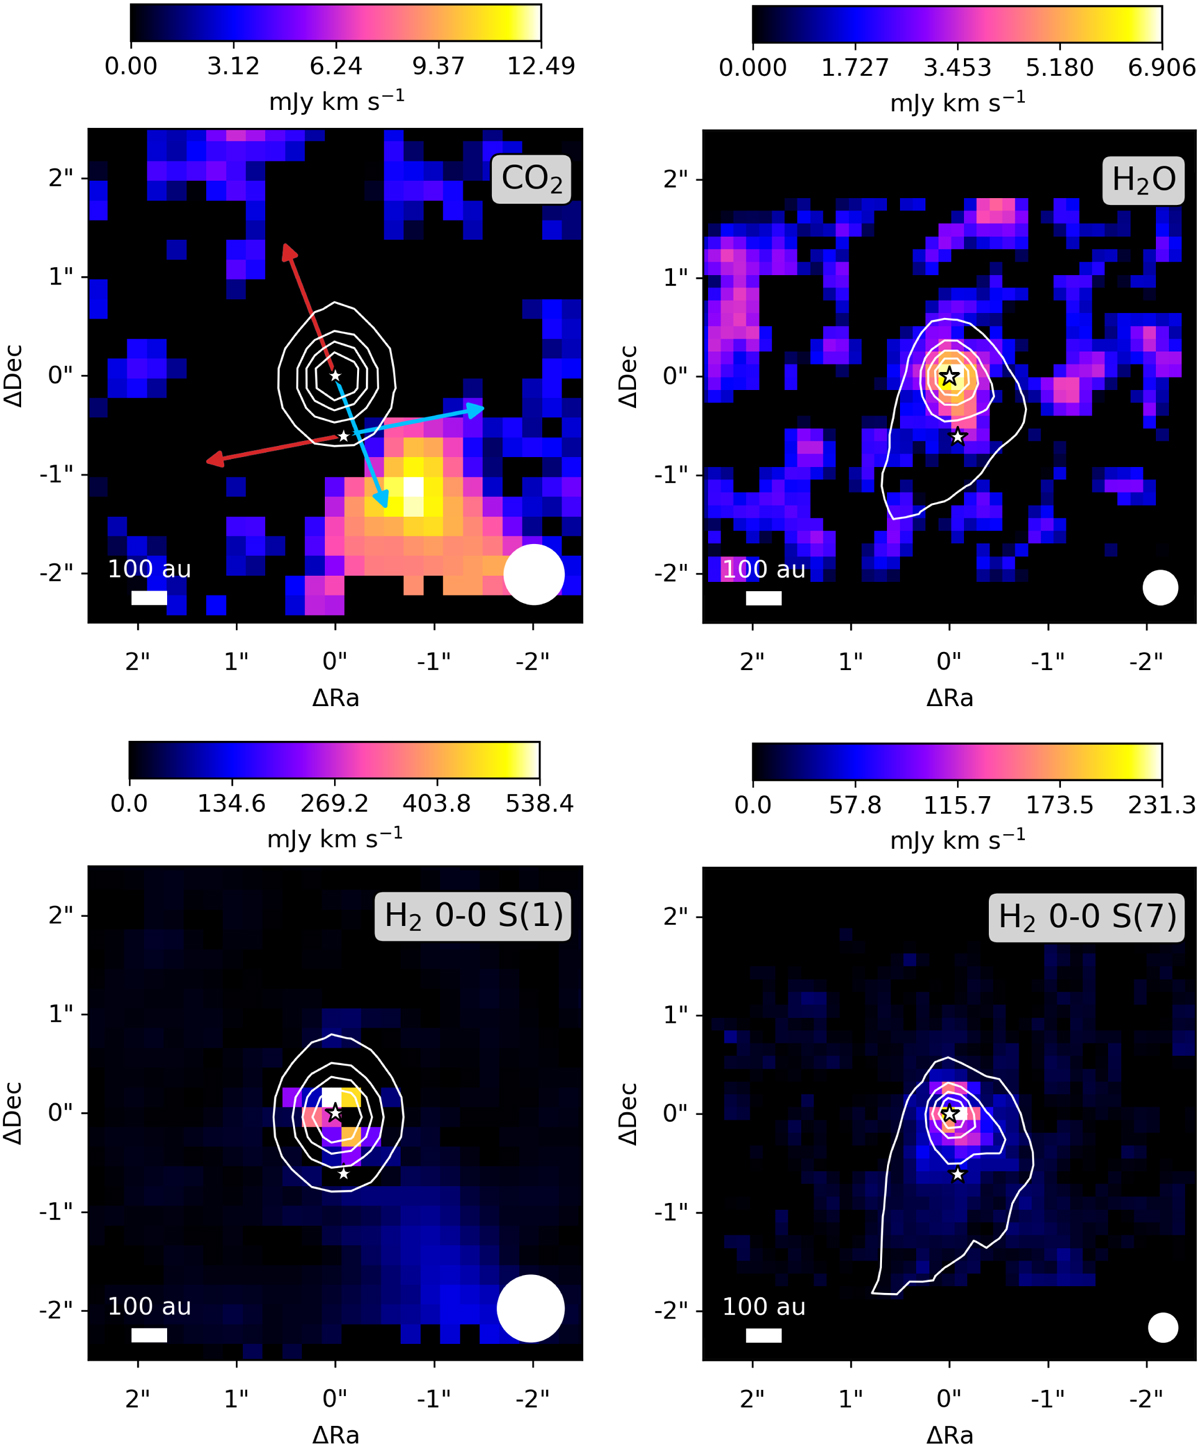
Fig. B.1
Download original image
Integrated intensity map of the CO2 v2 = 1 – 0 Q-branch (top left), H2O v2 = 1 – 0 42,3 – 53,2 (top right), H2 0-0 S(1) (bottom left), and H2 0-0 S(7) (bottom right) observed with MIRI-MRS in color. The images are integrated over [14.9,15.0] µm for CO2, [7.145-7.15] µm for H2O, and [−0.01,0.01] µm with respect to the transitions of H2. The extent of the continuum around the respective wavelengths is overlaid as white contours. A white scale bar is displayed in the bottom left of each panel, and the size of the PSF is presented as the filled white circle in the bottom right. The directions of the two outflows originating from IRAS2A1 and IRAS2A2 are indicated with the colored arrows in the top-left panel (Tobin et al. 2015). The H2O emission is peaking on-source on the same scales as SO2, whereas the CO2 and H2 0-0 S(1) emissions are clearly peaking in the outflow toward the southwest. The H2 0-0 S(7) line peaks mostly on-source but also has a component in the southwestern outflow.
Current usage metrics show cumulative count of Article Views (full-text article views including HTML views, PDF and ePub downloads, according to the available data) and Abstracts Views on Vision4Press platform.
Data correspond to usage on the plateform after 2015. The current usage metrics is available 48-96 hours after online publication and is updated daily on week days.
Initial download of the metrics may take a while.