Fig. 1
Download original image
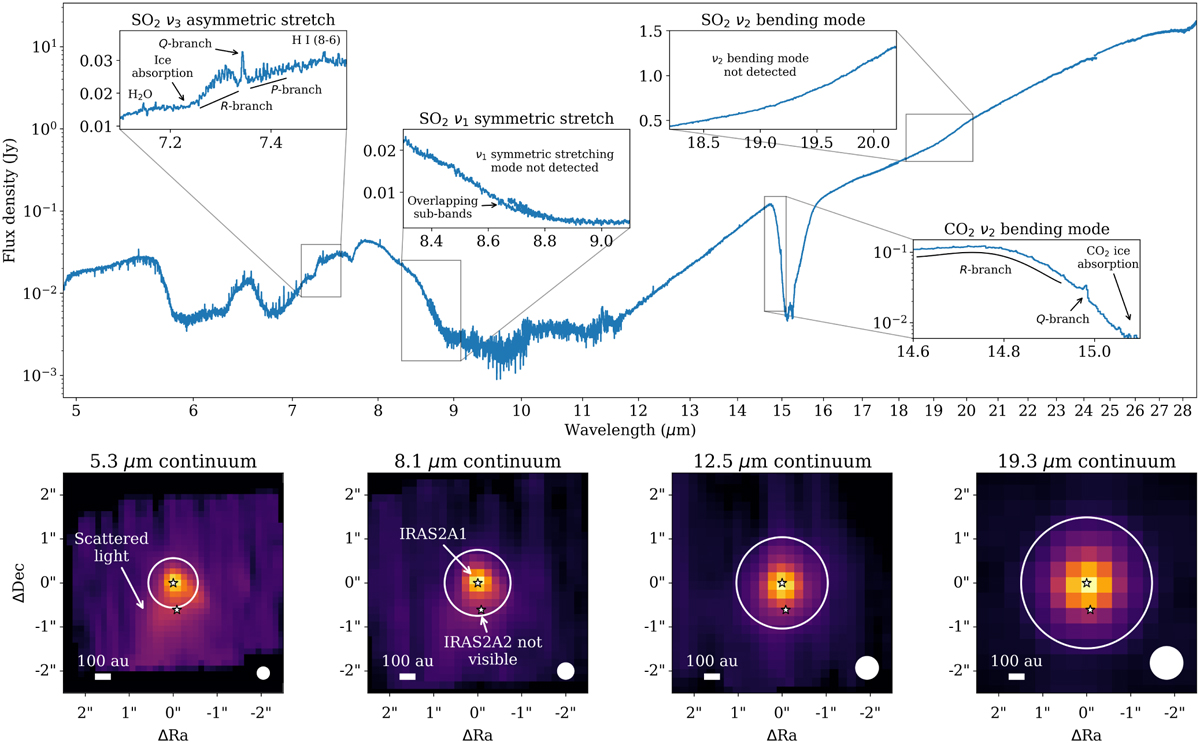
Spectrum (top panel) and continuum images at various wavelengths (bottom row) of IRAS 2A. In the top panel, four insets are presented: around the SO2 v3 asymmetric stretching mode (~7.35 µm), SO2 v1 symmetric stretching mode (~8.7 µm), SO2 v2 bending mode (~19 µm), and CO2 v2 bending mode (~15 µm). In the latter, the emission originates mostly from the outflow (see Fig. B.1). The 12 sub-bands of the MIRI-MRS spectrum are not stitched and show minor offsets in overlapping wavelengths (see, e.g., the inset on the SO2 v1 symmetric stretching mode). The bottom row shows, from left to right, the dust continuum around 5.3 µm, 8.1 µm, 12.5 µm, and 19.3 µm; a sqrt stretch has been used to enhance fainter features without over-saturating bright emission. The open white circle indicates the size of the aperture from which the spectrum was extracted (i.e, 1.1″, 1.5″, 2.1″, and 3.0" in diameter at 5.3 µm, 8.1 µm, 12.5 µm, and 19.3 µm, respectively), which increases as a function of wavelength with the increase in the size of the PSF. A scale bar is displayed in the bottom left of each panel, and the size of the PSF is presented as the filled white circle in the bottom right.
Current usage metrics show cumulative count of Article Views (full-text article views including HTML views, PDF and ePub downloads, according to the available data) and Abstracts Views on Vision4Press platform.
Data correspond to usage on the plateform after 2015. The current usage metrics is available 48-96 hours after online publication and is updated daily on week days.
Initial download of the metrics may take a while.