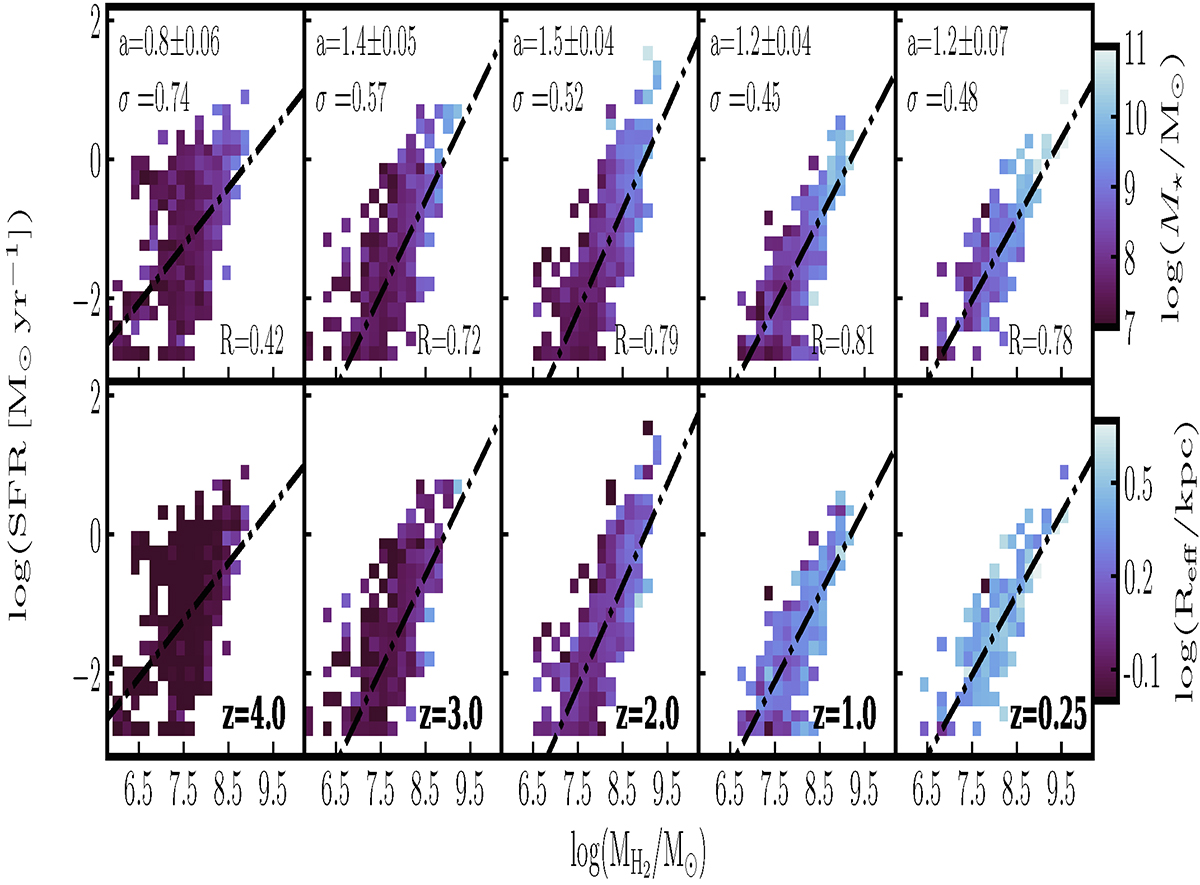
Fig. 9.

Download original image
Distribution of galaxies in the MH2–SFR plane, i.e., a deprojected version of the KS plane, at redshifts 4, 3, 2, 1, and 0.25, from left to right, as a function of galaxy mass (top) and effective radius (bottom). Dash-dotted lines are fits in the logarithmic space at each redshift, with the slope, a, and the standard deviation of residuals, σ. The coefficient R is the Pearson correlation coefficient. At all redshifts, more massive galaxies tend to have higher SFRs and MH2 values compared to their lower-mass counterparts. As galaxies grow in mass, they also grow in size; however, no obvious correlation is seen between Reff, the SFR, and the molecular gas mass.
Current usage metrics show cumulative count of Article Views (full-text article views including HTML views, PDF and ePub downloads, according to the available data) and Abstracts Views on Vision4Press platform.
Data correspond to usage on the plateform after 2015. The current usage metrics is available 48-96 hours after online publication and is updated daily on week days.
Initial download of the metrics may take a while.


