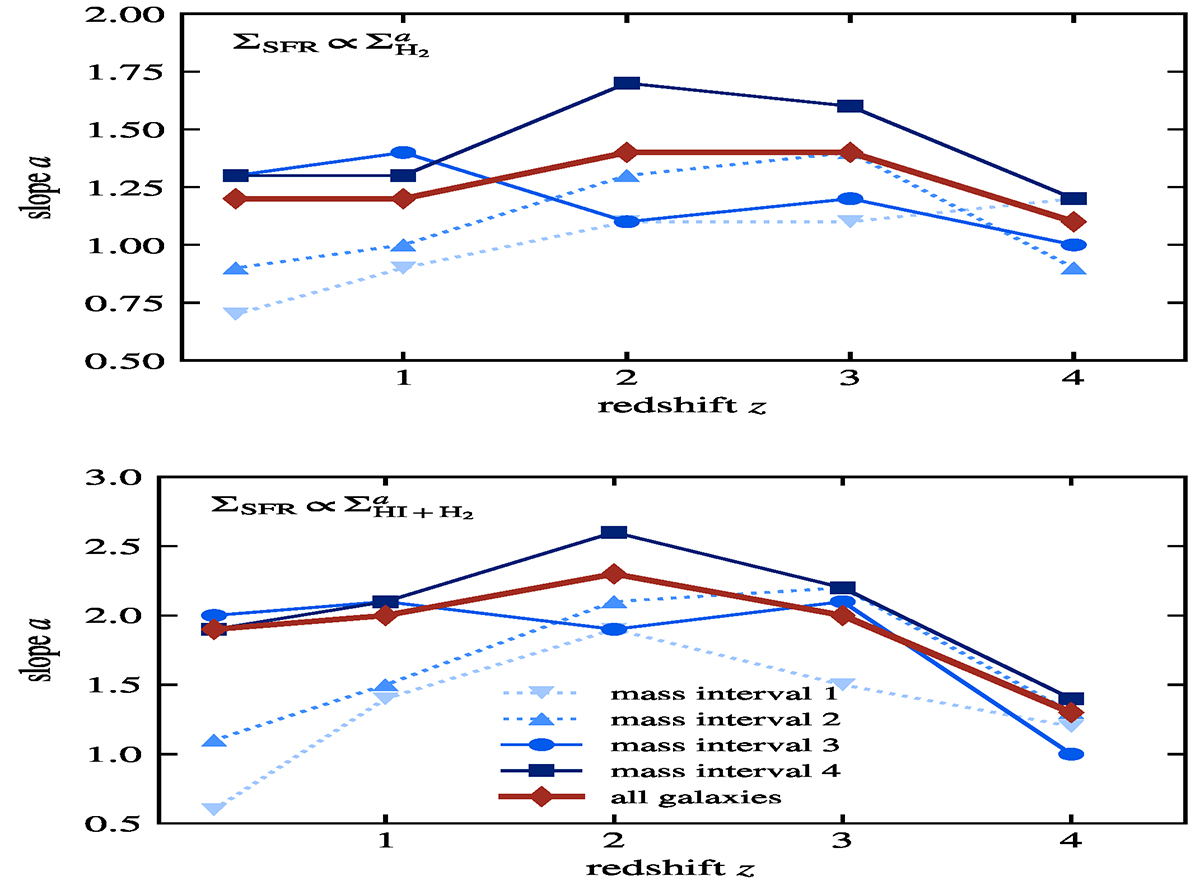
Fig. 4.
Download original image
Evolution of the slope of the fits of the KS relation from Figs. 2 and A.1, i.e., using the Bayesian fitting method, for the four mass bins considered, from the low-mass bin in a light color to the most massive one in a dark color. The red points show the slope of the entire galaxy population at a given redshift (i.e., without accounting for their mass, as in Fig. 3). After z ≈ 2 − 3, the slope of the KS relation for the two most massive bins remains within 30% (respectively 37%) of its final, converged, value for the molecular (respectively neutral) gas, which indicates the emergence of the KS relation at these redshifts. Low-mass galaxies do not show signs of convergence toward a fixed slope: their KS relation gets continuously shallower after z ≈ 2 − 3.
Current usage metrics show cumulative count of Article Views (full-text article views including HTML views, PDF and ePub downloads, according to the available data) and Abstracts Views on Vision4Press platform.
Data correspond to usage on the plateform after 2015. The current usage metrics is available 48-96 hours after online publication and is updated daily on week days.
Initial download of the metrics may take a while.