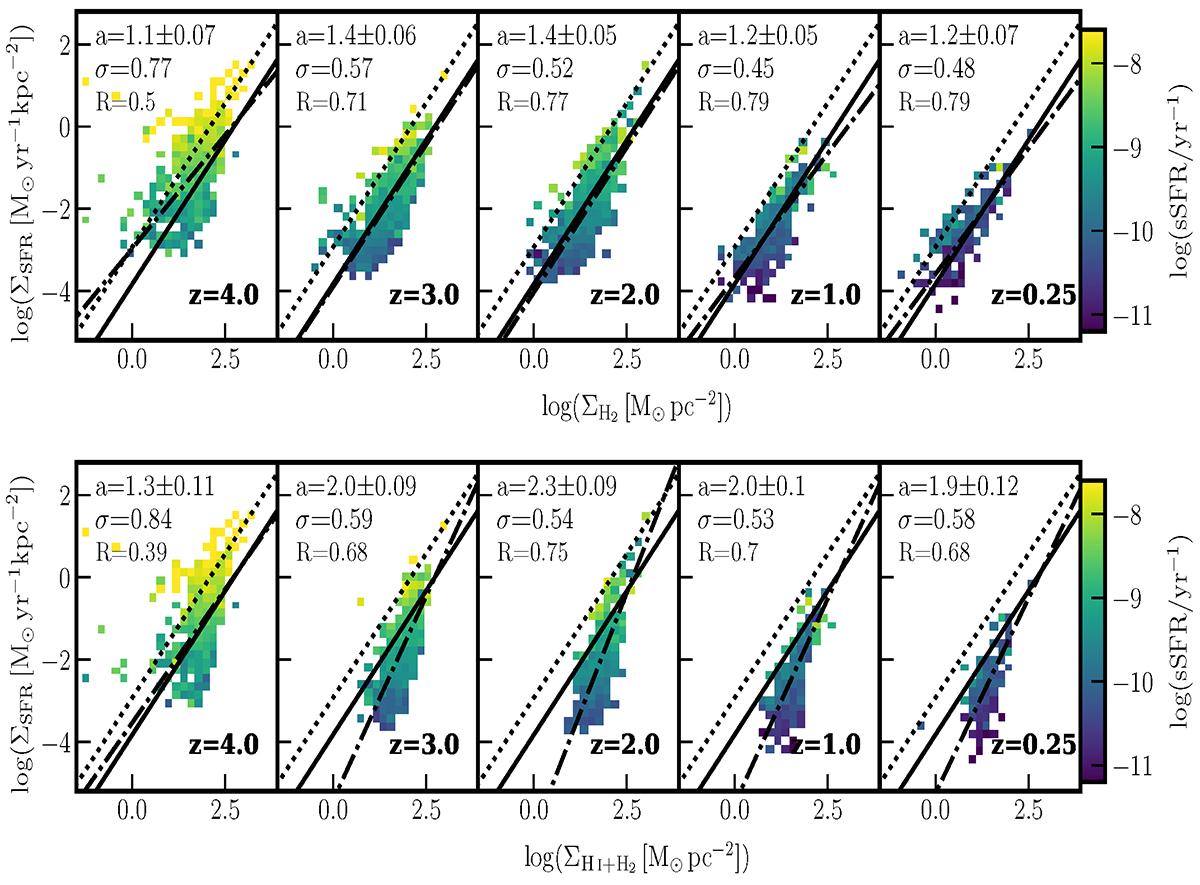
Fig. 3.
Download original image
Same as Figs. 2 and A.1, but without binning the stellar masses, and considering the molecular gas only (top) and the neutral gas (bottom). The correlation between the sSFR and ΣSFR seen in different stellar mass bins (Fig. 2) is still apparent when stacking all galaxies. At all redshifts, the slope (a) and the dispersion (σ) around the best-fit relation (dash-dotted line) are larger for the neutral gas than for the molecular gas. At all redshifts, the correlation is stronger for molecular gas than for neutral gas.
Current usage metrics show cumulative count of Article Views (full-text article views including HTML views, PDF and ePub downloads, according to the available data) and Abstracts Views on Vision4Press platform.
Data correspond to usage on the plateform after 2015. The current usage metrics is available 48-96 hours after online publication and is updated daily on week days.
Initial download of the metrics may take a while.