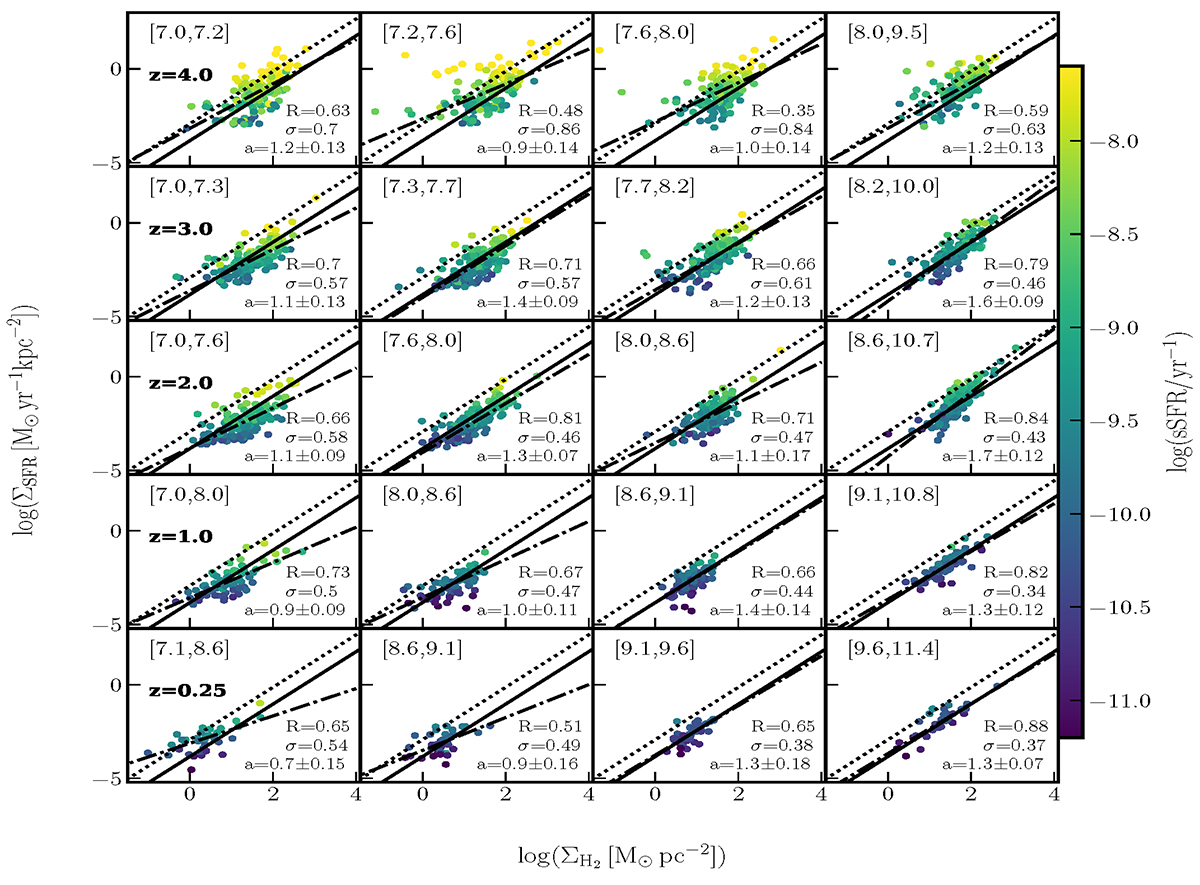
Fig. 2.
Download original image
Distribution of galaxies in the KS plane at different redshifts (rows) and in four equally populated stellar mass quartiles at each redshift (columns). The mass range of each quartile is shown in square brackets (in log M⊙). The colors indicate the sSFR of the galaxies, measured over a timescale of 10 Myr. Dash-dotted lines are fits at each redshift and mass bin, with the slopes (a) and the standard deviation of residuals of the best-fit relation (σ) shown in the lower-right corners. The coefficient R, shown at the bottom right of each panel, is the Pearson correlation coefficient. The solid black and dotted black lines show the sequence of disks and starbursts, respectively, from Daddi et al. (2010) for reference. Note, however, that our fitting method differs from theirs. Regardless of stellar mass, the distributions of galaxies move within the KS plane toward lower values of ΣH2 and ΣSFR with decreasing redshift. At each redshift and in each stellar mass bin, the sSFR of galaxies strongly correlates with ΣSFR. Figure A.1 shows the same but using the neutral gas.
Current usage metrics show cumulative count of Article Views (full-text article views including HTML views, PDF and ePub downloads, according to the available data) and Abstracts Views on Vision4Press platform.
Data correspond to usage on the plateform after 2015. The current usage metrics is available 48-96 hours after online publication and is updated daily on week days.
Initial download of the metrics may take a while.