Open Access
Fig. B.1.
Download original image
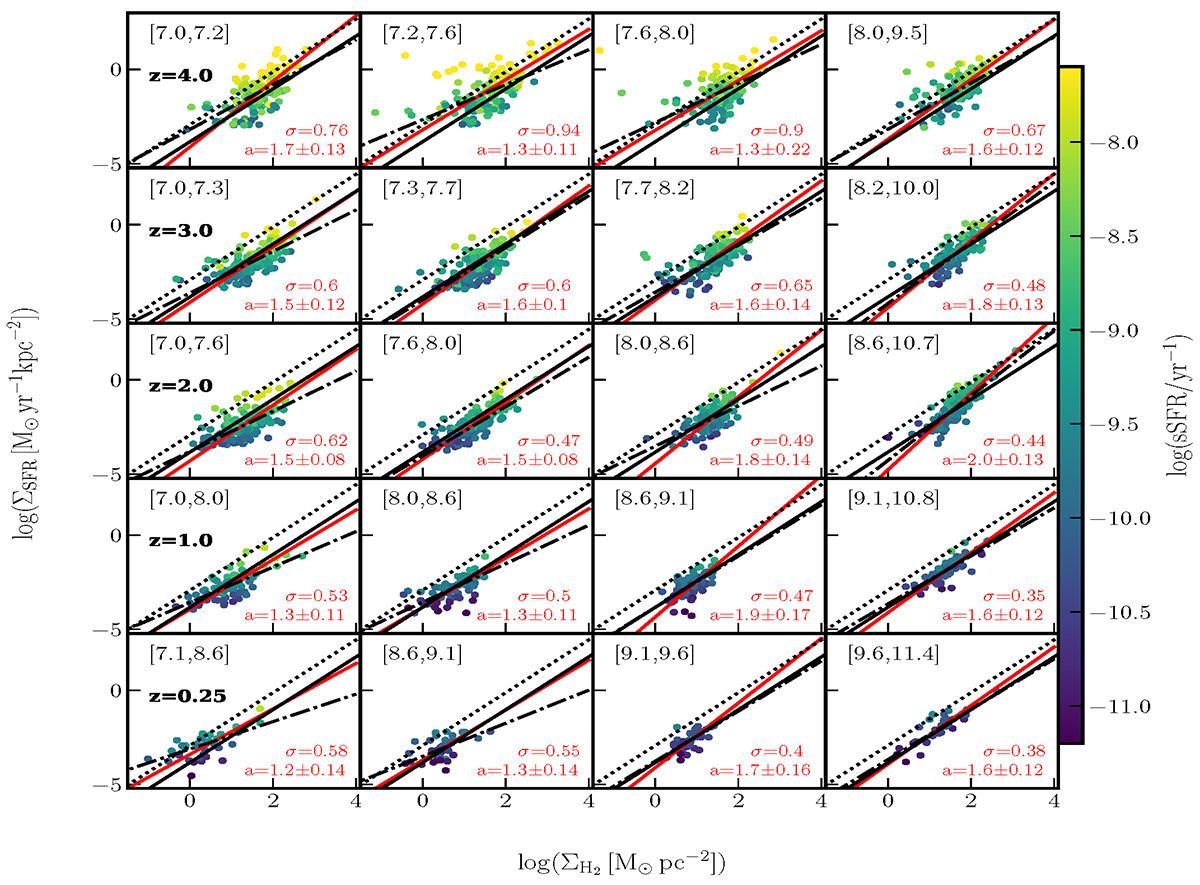
Same as Fig. 2, but showing in addition OLS bisector (solid red lines) and Bayesian fits (dash-dotted black lines) for comparison. The corresponding OLS bisector best-fit values for the slope, a, and the standard deviation of residuals, σ, are shown in the bottom-right corners of each panel.
Current usage metrics show cumulative count of Article Views (full-text article views including HTML views, PDF and ePub downloads, according to the available data) and Abstracts Views on Vision4Press platform.
Data correspond to usage on the plateform after 2015. The current usage metrics is available 48-96 hours after online publication and is updated daily on week days.
Initial download of the metrics may take a while.