Fig. 5.
Download original image
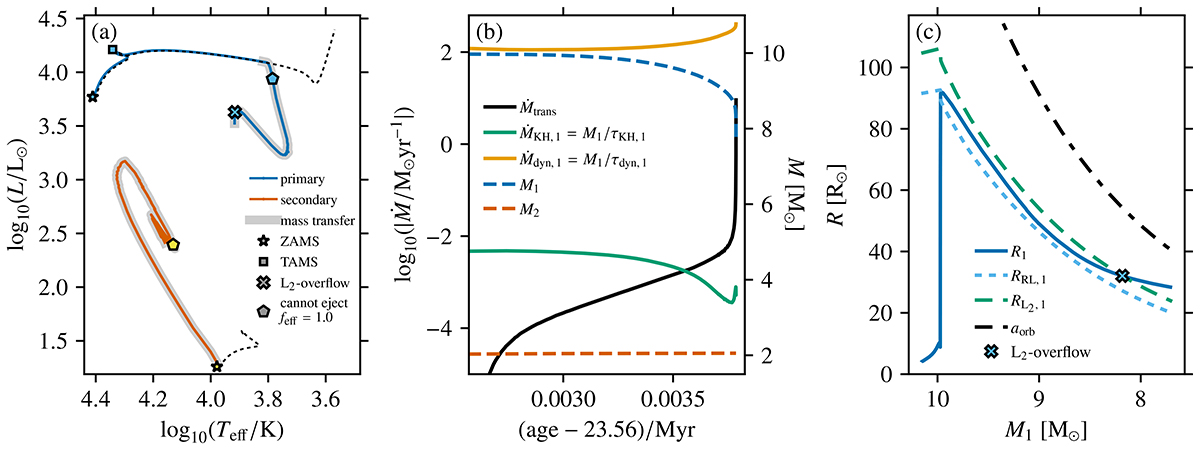
Example of a binary model with M1, i = 10.2 M⊙, qi = 0.2, and ai = 175.7 R⊙ going through a phase of (delayed) runaway mass transfer. Panel a is the same as Fig. 3a (‘ign.’ = ‘ignition’). Panel b shows the mass-transfer rate Ṁtrans (solid black line), thermal mass-transfer rate ṀKH (solid green line) and dynamical mass-transfer rate Ṁdyn (solid gold line) for the primary star on the left axis. The right axis shows the component mass evolution as a function of age (dashed blue and orange lines). In panel c, the radius R (solid blue line), Roche lobe radius RRL (dashed light-blue line), L2-volume-equivalent radius RL2 (dahsed green line, Misra et al. 2020, Eq. (15)) and orbital separation aorb (dashed black line) evolution for the primary are shown as a function of the decreasing primary mass. The blue cross indicates the moment of L2-overflow.
Current usage metrics show cumulative count of Article Views (full-text article views including HTML views, PDF and ePub downloads, according to the available data) and Abstracts Views on Vision4Press platform.
Data correspond to usage on the plateform after 2015. The current usage metrics is available 48-96 hours after online publication and is updated daily on week days.
Initial download of the metrics may take a while.