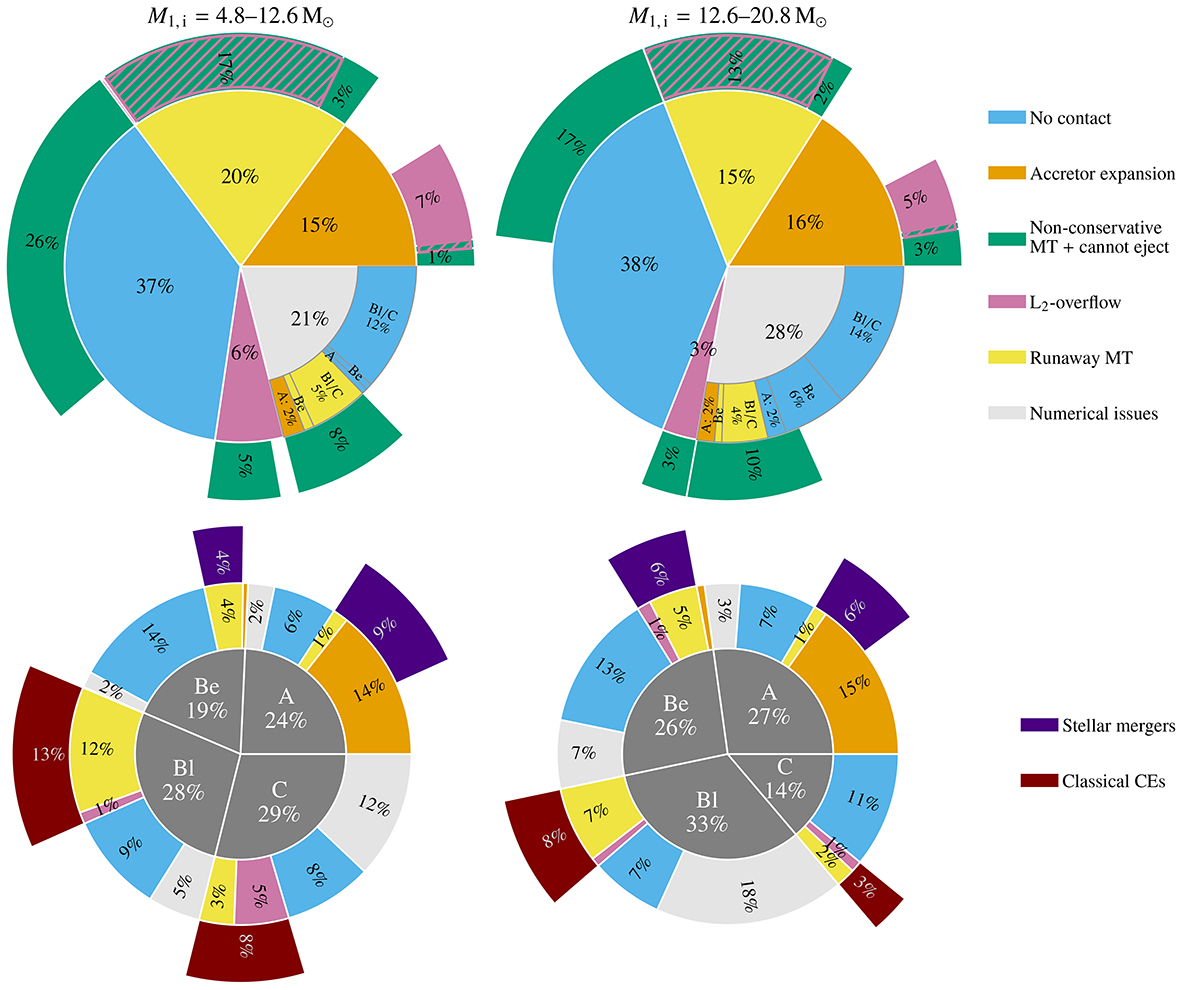
Fig. 10.
Download original image
Sunburst charts displaying the fractions of evolutionary outcomes for mass-transferring binary systems in the grid over initial primary mass ranges of [4.8; 12.6) M⊙ (left) and [12.6; 20.8] M⊙ (right). Wedges with a percentage < 1% are not labelled. Top row: the inner level shows the principal outcome of the evolution (‘Accretor expansion’, ‘Runaway MT’, ‘L2-overflow’, and ‘No contact’), while the outer level shows the ancillary outcome (‘L2-overflow’, ‘Non-conservative MT + cannot eject’). Ancillary ‘No contact’ outcomes are incorporated in the inner ‘No contact’ category. Models in the ‘Numerical issues’ category are assigned a likely evolutionary outcome based on their initial mass ratio qi and mass-transfer case, displayed on the sunburst chart’s intermediate level. The labels ‘A’, ‘Be’, and ‘Bl/C’ refer to Case-A, Case-Be, and Case-Bl or -C mass transfer, respectively. Bottom row: the inner level shows the percentage of Case-A, -Be, -Bl, and -C systems. We show the principal outcome per case on the middle level. The outer level shows the lower limits of the total fraction of stellar mergers and classical CEs per mass-transfer case.
Current usage metrics show cumulative count of Article Views (full-text article views including HTML views, PDF and ePub downloads, according to the available data) and Abstracts Views on Vision4Press platform.
Data correspond to usage on the plateform after 2015. The current usage metrics is available 48-96 hours after online publication and is updated daily on week days.
Initial download of the metrics may take a while.