Fig. 1
Download original image
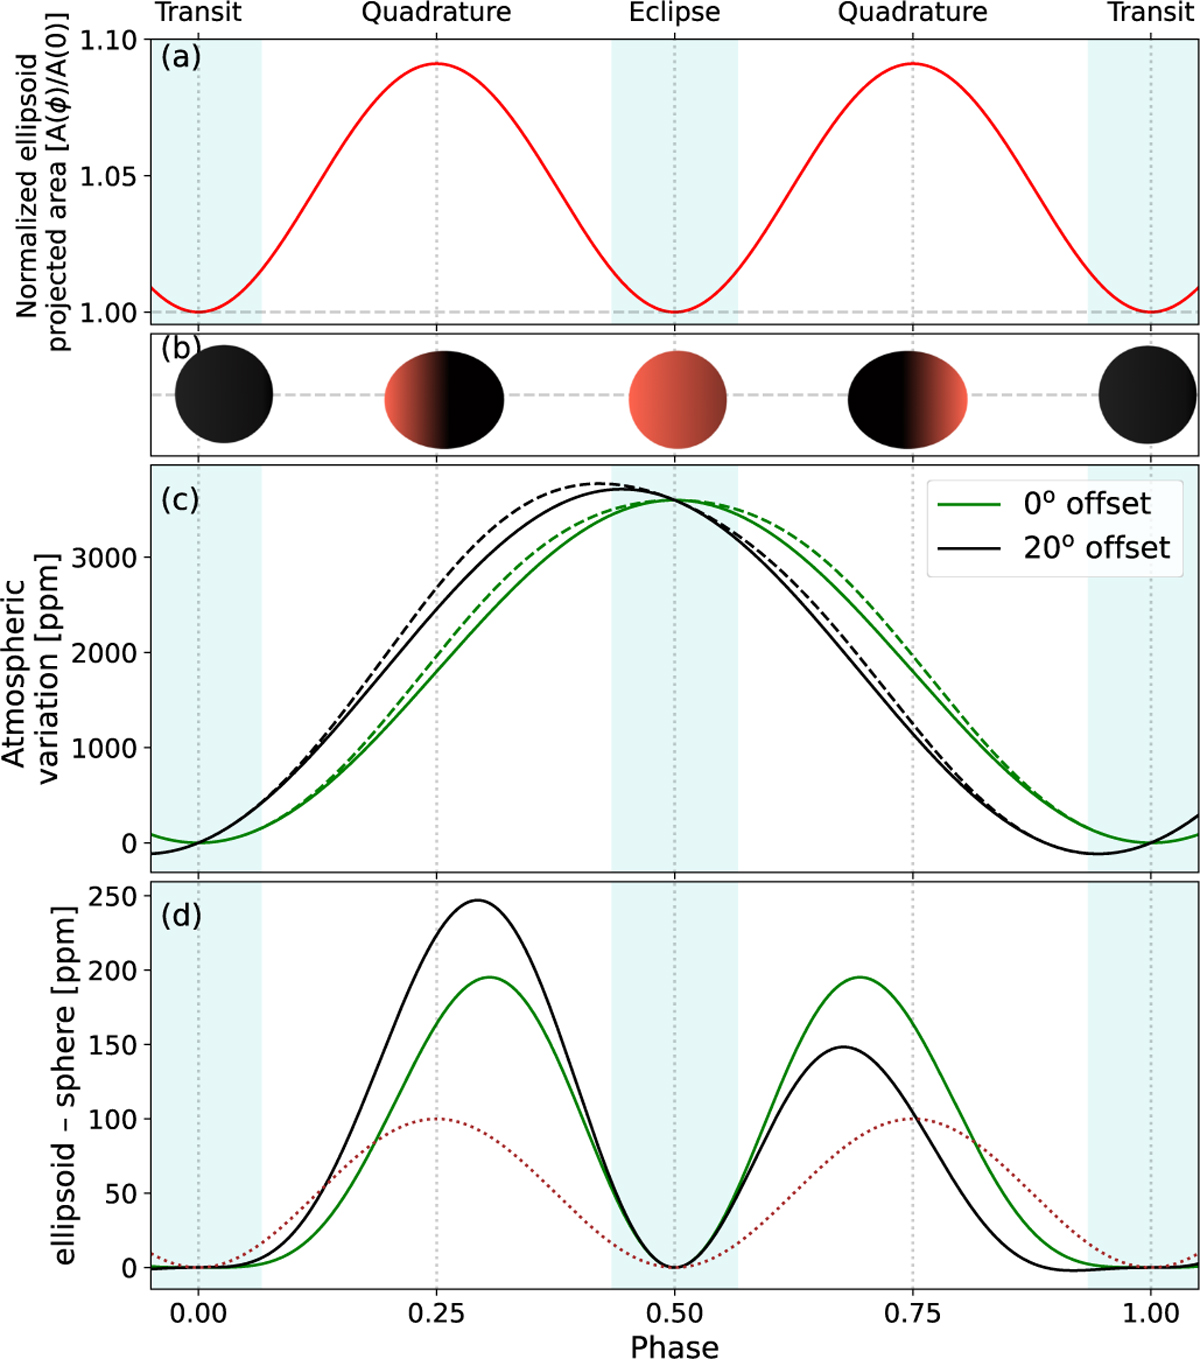
Deformed planet phase curve components. (a) Phase-dependent projected area of an ellipsoid normalized to the projected area at phase zero (mid-transit). (b) Schematic of the projected ellipsoidal planet shape at different phases and the illuminated regions. (c) Atmospheric phase variation of a spherical (solid) and ellipsoidal (dashed) planet calculated analytically using Eq. (11). The cases with (green) and without (black) phase offset are shown. (d) Difference between the ellipsoidal and spherical planet atmospheric phase variations for the cases with and without phase offset. This represents the contribution of deformation to the planetary signal. For comparison, the stellar ellipsoidal variation FEV with a peak-to-peak amplitude of 100 ppm is also shown as the brown dotted curve. The cyan shaded regions in all panels represent the in-transit and in-eclipse phases.
Current usage metrics show cumulative count of Article Views (full-text article views including HTML views, PDF and ePub downloads, according to the available data) and Abstracts Views on Vision4Press platform.
Data correspond to usage on the plateform after 2015. The current usage metrics is available 48-96 hours after online publication and is updated daily on week days.
Initial download of the metrics may take a while.