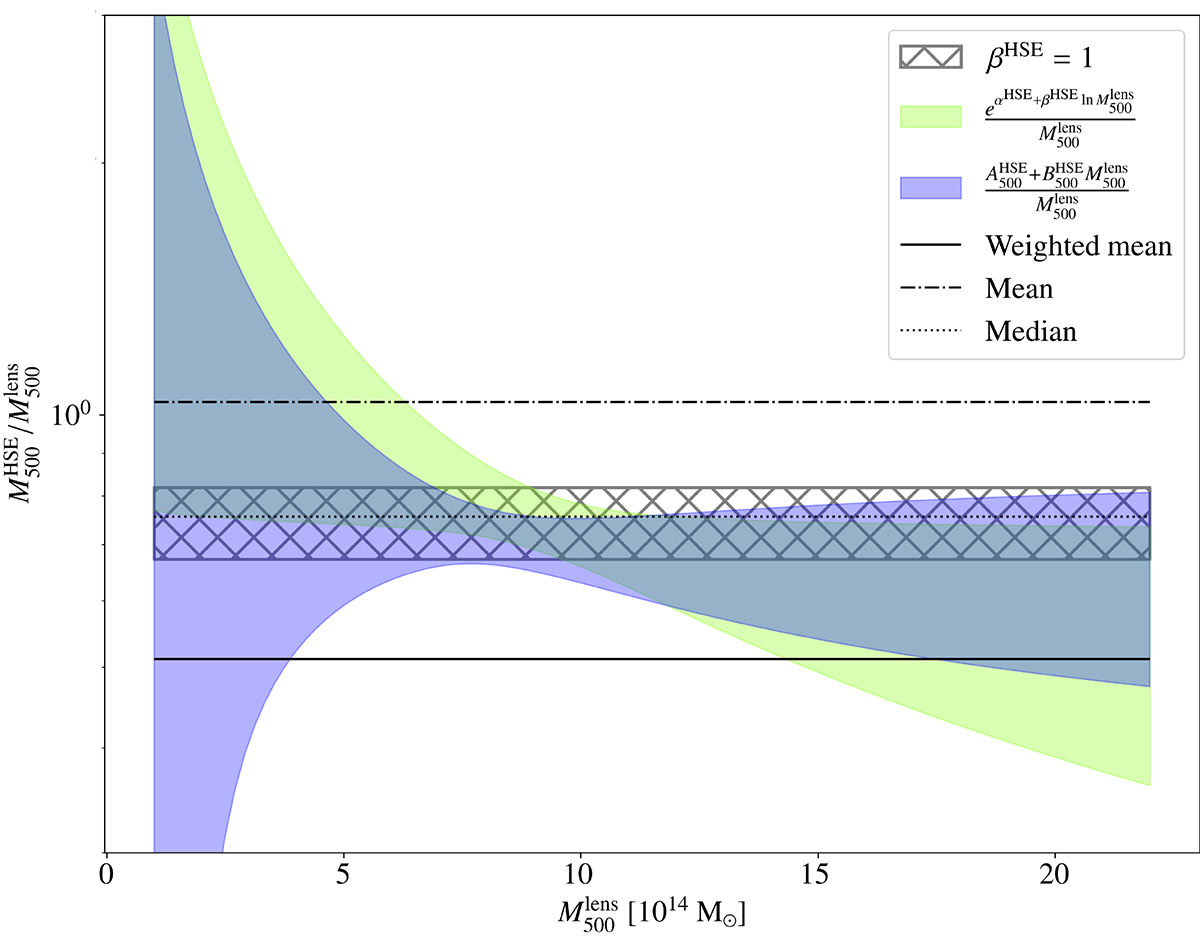
Fig. 8.
Download original image
HSE-to-lensing mass ratio with respect to lensing mass. The grey hatched area indicates the 16th to 84th percentiles of the bias without mass dependence, accounting for systematic scatters in the uncertainties of HSE and lensing masses. The green area shows the bias evolution when assuming a deviation from linearity of the HSE and lensing masses. Blue area indicates the bias evolution when considering an offset between HSE and lensing masses. Horizontal solid, dotted, and dash-dotted black lines give respectively the weighted mean, median, and mean mass ratio for the 53 clusters, same as in Fig. 3.
Current usage metrics show cumulative count of Article Views (full-text article views including HTML views, PDF and ePub downloads, according to the available data) and Abstracts Views on Vision4Press platform.
Data correspond to usage on the plateform after 2015. The current usage metrics is available 48-96 hours after online publication and is updated daily on week days.
Initial download of the metrics may take a while.