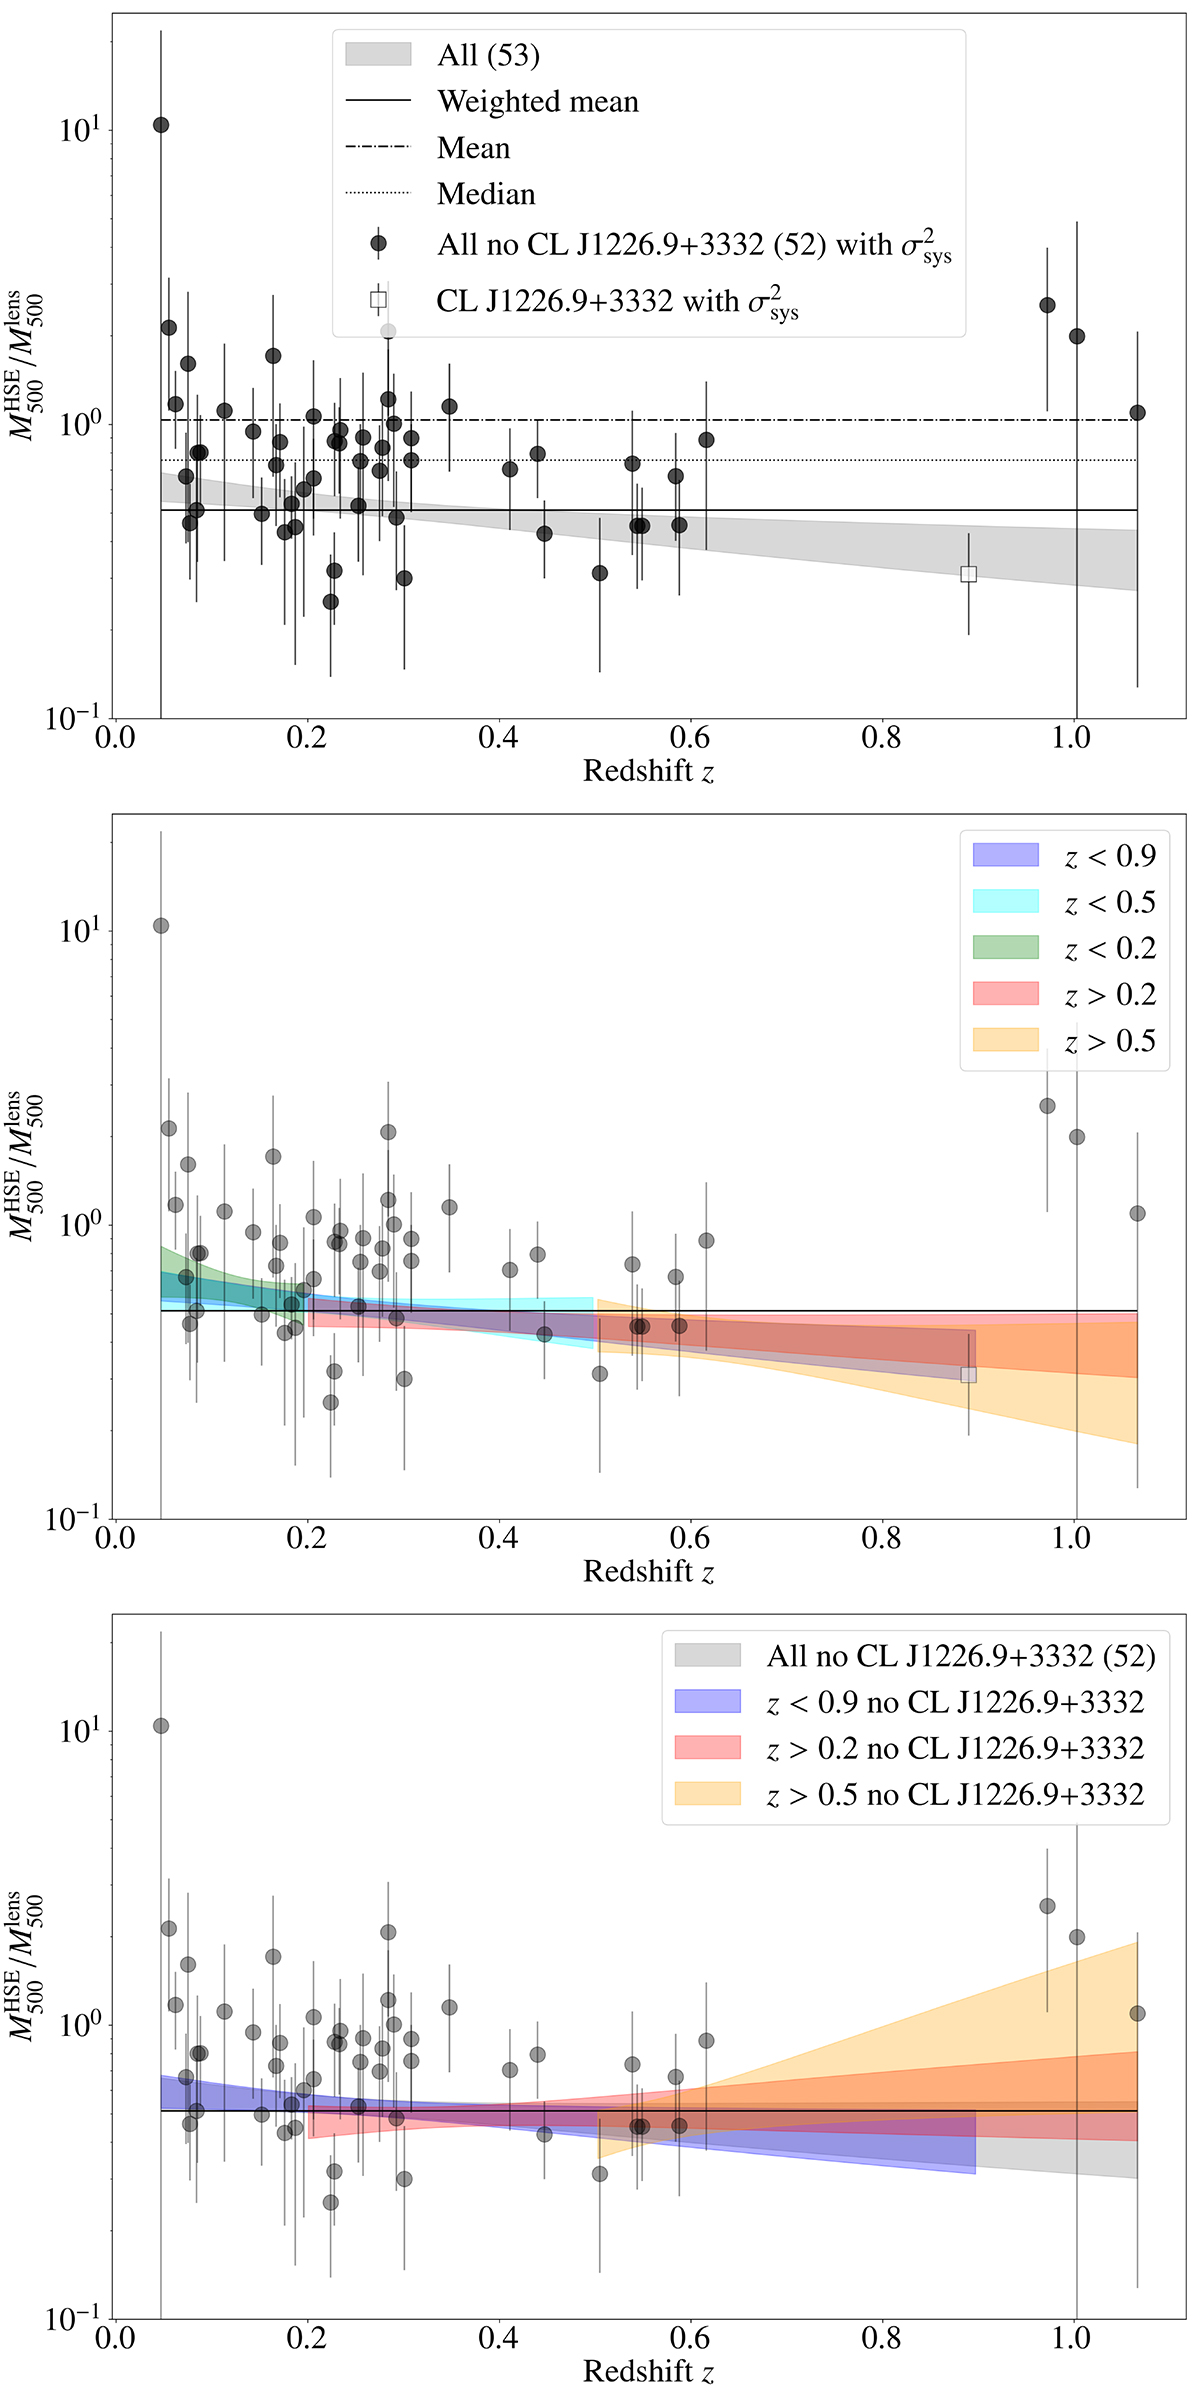
Fig. 3.
Download original image
HSE-to-lensing mass ratio with respect to the redshift. Markers with error bars show the ratio of each cluster in the reference sample with error bars accounting for the systematic uncertainty. Horizontal solid, dotted, and dash-dotted black lines give respectively the error weighted mean, median, and mean mass ratio for the data points. Shaded areas represent the 16th to 84th percentiles of the bias evolution model obtained by fitting different redshift ranges. Top: the bias evolution model obtained with the 53 clusters in the reference sample. Centre: different colours indicate the models fitted to clusters in different redshift ranges. Bottom: grey, blue, red, and orange shaded areas show respectively the bias evolution model fitted to clusters along all the redshift range, at z < 0.9, at z > 0.2, and at z > 0.5, excluding in all the cases the CL J1226.9+3332 galaxy cluster.
Current usage metrics show cumulative count of Article Views (full-text article views including HTML views, PDF and ePub downloads, according to the available data) and Abstracts Views on Vision4Press platform.
Data correspond to usage on the plateform after 2015. The current usage metrics is available 48-96 hours after online publication and is updated daily on week days.
Initial download of the metrics may take a while.