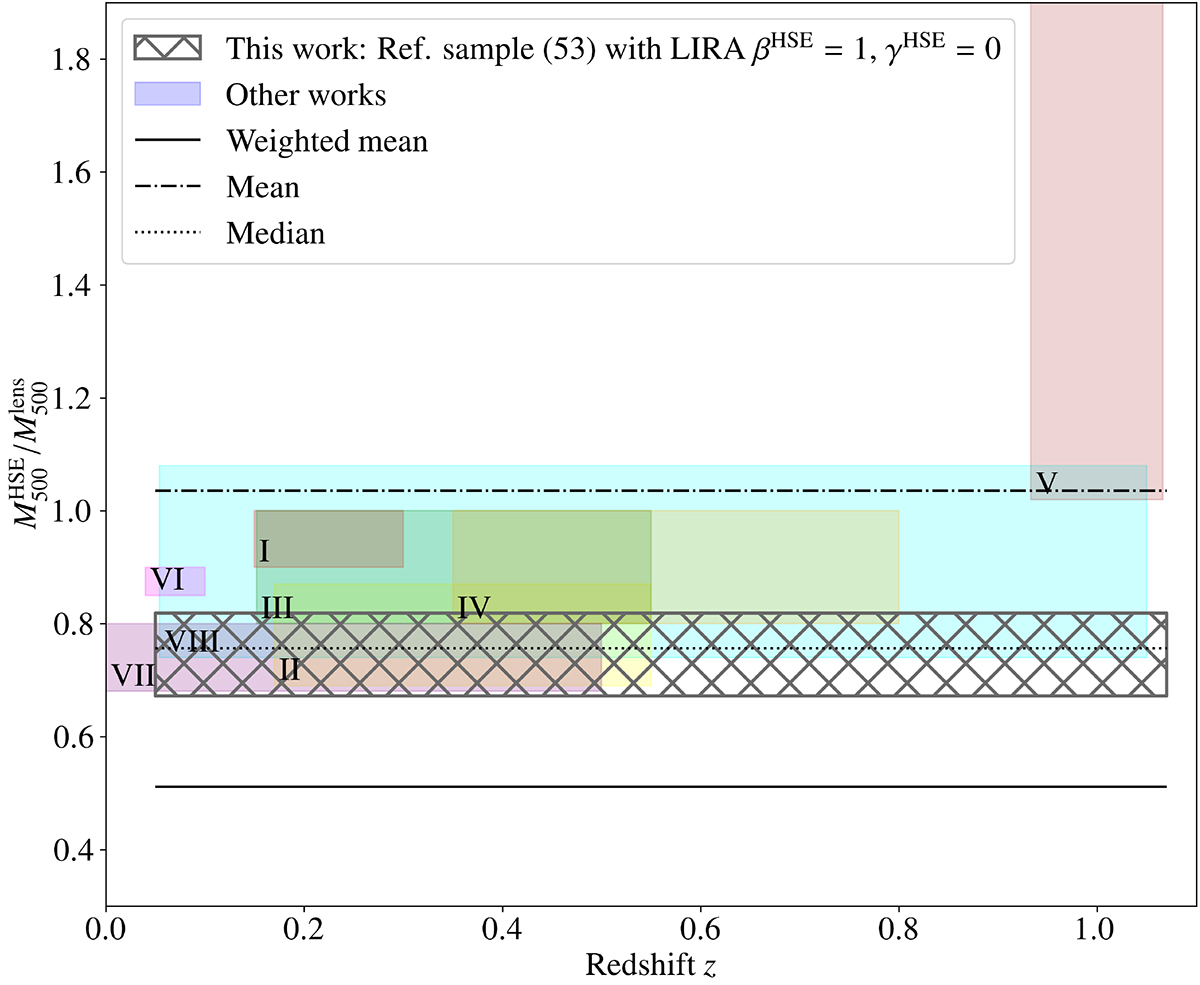
Fig. 12.
Download original image
HSE-to-lensing mass ratio with respect to redshift. Shaded areas indicate different results from different works in the literature. See text and Table 5 to identify Roman numerals with the works. The horizontal grey hatched area represents the HSE-to-lensing mass ratio measured in this work assuming that HSE and lensing masses scale linearly with the true mass, accounting for the systematic scatter, and considering no evolution with redshift.
Current usage metrics show cumulative count of Article Views (full-text article views including HTML views, PDF and ePub downloads, according to the available data) and Abstracts Views on Vision4Press platform.
Data correspond to usage on the plateform after 2015. The current usage metrics is available 48-96 hours after online publication and is updated daily on week days.
Initial download of the metrics may take a while.